The Lehmann Letter ©
Friday
November 16, 2007
Industrial Production & Capacity Utilization
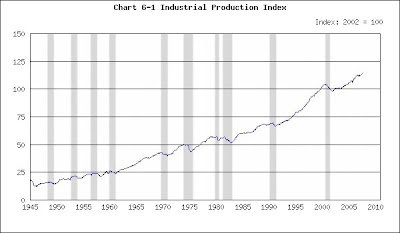
This morning the Federal Reserve (the Fed) reported that October industrial production had fallen half a percent from September to 114.6 (2002 = 100). It’s been flat all summer and into the fall.
Industrial production measures the output of the mining, manufacturing and public utilities industries. It’s recorded as an index, with 2002 set at 100, so that a single figure can represent the activity of a variety of industries that measure their results in tons, yards, kilowatts and so on. That way, one number can represent all.
This release will help you understand why economic forecasting is not easy. There will be two reactions to it. The first will say, ”Bad news. This confirms that the economy is faltering. It’s down hill from here.” The second will say, “Good news. This confirms that the economy is not over heating. The Fed won’t have to raise interest rates.”
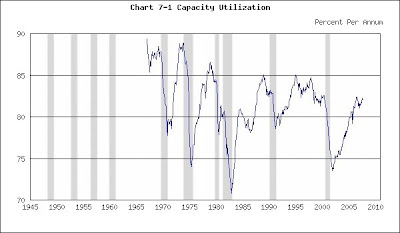
The chart below presents industrial production’s record: Mostly up, except for recessions. That makes it difficult to grasp the polar extremes of the last paragraph. To appreciate those extremes, look at the next chart that portrays capacity utilization. It illustrates matters quite well.
Industrial Production (Recessions shaded)

Capacity Utilization (Recessions shaded)

Capacity utilization asks and answers the following question, “What is the current level of industrial output expressed as a percentage of the maximum?” Thus, if a factory can produce 100 tons of stuff per day and is currently generating 90, it is operating at 90% of capacity.
The Fed reported October’s figure at 81.7%. The record shows capacity utilization as flat all summer and into the fall. Once again, some will say “bad news” and others will say “good news.”
Fortunately the capacity-utilization chart is easier to interpret than the industrial-production chart. Because capacity utilization presents a ratio between two numbers – what we can produce and what we are producing – you can intuitively understand that a very high figure indicates we are straining productive facilities while a low number indicates slack in the economy. Anything above 85% means we’re pushing too hard, leading to inefficiency and rising cost and prices. Between 80% and 85% is ideal. Under 80% runs the risk of slump.
Think of your car’s engine as an analogy. If you push the accelerator to the floor and drive too fast, you strain the engine and fuel efficiency – measured in miles per gallon – falls. It’s an expensive ride. But a relaxed, even speed, say 50 miles per hour, will maximize fuel efficiency and reduce driving costs. The economy is like an engine. A leisurely pace is most efficient.
Right now, at 81.7% of capacity, the economy is operating at its sweet spot. There’s no need for the Fed to speed it up or slow it down. Keep track of this number in coming months to see whether it rises or falls. Here’s how:
Industrial Production & Capacity Utilization
http://www.federalreserve.gov/
Step 1: Click on "All Statistical Releases" under "Recent Statistical Releases" and then click on "Industrial Production and Capacity Utilization" under "Principal Economic Indicators" in the upper left
Step 2: Click on "Current Monthly Release"
Step 3: Find the latest monthly data in the table next to "Total index" and "Total industry"
No comments:
Post a Comment