The Lehmann Letter ©
Today’s GDP numbers were awful (http://www.bea.gov/national/nipaweb/TableView.asp?SelectedTable=1&Freq=Qtr&FirstYear=2006&LastYear=2008 ). Last month’s preliminary estimate of 2008’s fourth-quarter decline was -3.8%. This has now been revised to -6.2%. A GDP revision of this magnitude is rare and is another sign of the economy’s startling deterioration. (A final revision will appear at the end of next month, but it probably won’t materially improve today’s figure.)
Here are the data:
................................2008-I.... 2008-II...2008-III....2008-IV
Gross domestic product……......0.9.........2.8..........-0.5.......-6.2
Consumption.............................0.9..........1.2.........-3.8.......-4.3
Investment..............................-5.8.........-11.5.........0.4......-20.8
Net exports...............................4.6..........17.5........7.4.........-5.6 Government.............................5.8............6.6….....13.8........6.7
Consumption, investment and trade dragged the economy downward. Only government expenditures propped it up. Investment’s 20.8% plunge reflects business plant and equipment’s sharp drop, compounding residential construction’s continued deterioration. Compared to investment’s contraction, consumption’s shrinkage seems small. But the percentages mask the fact that consumption accounts for three/fourths of GDP. Finally, the decline in net exports signals that the contraction in the rest-of-the-world’s economies has hit us.
These numbers may compel the President’s advisors to revise their forecasts downward. If the economy falls further and longer than they anticipated, it means that they will have to revisit their federal-budget projections. Federal-budget deficits may be bigger and more protracted than initial calculations indicated.
© 2009 Michael B. Lehmann
Friday, February 27, 2009
Thursday, February 26, 2009
Heroic Assumptions?
The Lehmann Letter ®
Today’s news reported that the President’s budget calculations include the projection that GDP will contract by 1.2% this year and expand by 3.2%, 4.0% and 4.6% in each of the following years. In addition, the budget assumes unemployment will rise to 8.1% this year and fall slightly to 7.9% next year.
Let’s hope so.
Because if those numbers are too optimistic and GDP falls more sharply and recovers more slowly so that unemployment rises to 10% or more, the president’s objective of halving the deficit by the end of his first term won’t be met. Here’s why: Reducing the deficit by half depends upon strong growth in tax revenue, and that depends upon a healthy increase in output and income because federal tax revenues (income tax and profits tax) grow with income. If recovery from recession is robust (V-shaped), as the President’s projection assumes, then surging revenues will swiftly reduce the deficit. But if this recovery is halting (U-shaped) or, worse yet, stunted (L-shaped), the President’s projection will fail.
Recall the rosy forecasts made earlier in this decade of ever-larger budget surpluses for the foreseeable future. Those estimates assumed there would be no recession and no tax cuts, assumptions that the 2001 recession voided. That recession sharply reduced income while tax cuts abridged the tax take from that income. Budget surpluses swiftly became deficits.
The current recession has already reduced output, income and income-tax revenue. The chief question is: How swiftly will they rebound? That depends upon the strength of the economic recovery and the extent to which any tax increases on the wealthy offset tax reductions for the less affluent. Let’s hope the President can get his tax program through Congress. Let’s also hope the President’s GDP and employment projections come true.
© 2009 Michael B. Lehmann
Tuesday, February 24, 2009
A Choice, Not An Echo
The Lehmann Letter ®
In 1964 Barry Goldwater, the Republican candidate for president, promised the nation a choice, not an echo. Senator Goldwater pledged not be Democratic-light: A mere echo of the Democratic voice. No, Mr. Goldwater said he would adhere to free-market principles and take the nation in an entirely different direction.
Senator Goldwater lost to Lyndon Johnson. But Ronald Reagan carried the Senator’s free-market principles to victory in 1980. And he gave them special emphasis by adding supply-side economics. Mr. Reagan said he would spur the market forward with tax cuts skewed in favor of upper-income earners. That, Mr. Reagan said, would provide additional incentives for the movers and shakers to work harder while enabling additional saving to spur investment.
Governor Bobby Jindal, Republican of Louisiana, reaffirmed President Reagan’s views this evening. Governor Jindal’s response to President Obama’s address to a joint session of Congress carefully distinguished itself from President Obama’s approach. The president’s plan, Governor Jindal said, relied on more government spending. The governor declared plainly that he preferred cutting taxes.
The president’s approach is standard Keynesian economics: Boost government spending and cut taxes for lower-income earners. That will lift aggregate demand, justifying additional output and income. Governor Jindal’s view is straight supply-side Reaganomics. The distinction could not be clearer. One offers to boost demand; the other says it will grow supply. The governor offered a choice, not an echo.
© 2009 Michael B. Lehmann
Monday, February 23, 2009
The Spring of ‘97
The Lehmann Letter ®
Today the stock market fell back to its spring 1997 level.
It would be bad enough if we had suffered stagnation over the past 12 years, so that the market did not have far to fall. But that’s not the case. We’ve had two booms in the intervening years: The dot-com bubble of the late 1990s and the housing bubble of 2003-2007. In both cases the stock market and the economy surged to robust levels before tumbling back down. The tech boom ignited the first boom. What generated the second (housing) surge and collapse?
We know about the Federal Reserve’s easy money policy and the marketing of sub-prime mortgages. To get the big picture, however, it’s useful to think of the nation’s balance sheet: Assets on the left and debt together with net worth on the right. All of us would like to build the left side – cash, investments, cars, homes – with as little debt as possible on the right side. That didn’t happen. We piled up the cars and homes on the left side by financing their acquisition with growing debt on the right side.
That, of course, meant that the ratio of net worth (assets minus liabilities) to debt fell as the mountain of homes and cars grew – financed by debt (liabilities). When financial analysts examine balance sheets they conduct a variety of tests to determined their health. One test examines the ratio of cash or cash equivalents (bank accounts, U.S. Treasury securities) to debt. As our debts grew faster than our cash, we failed that test. But it wasn’t clear that we were failing the other test: The ratio of net worth to debt.
That’s because asset inflation boosted the value of our stock-market portfolio and our home’s values without adding to our debt. That built our net worth (assets minus liabilities). This offset the effect of rising debt employed to acquire cars and homes. In a nutshell the two ratios – cash to debt and net worth to debt – did not cause alarm despite the deterioration of the first. Net worth to debt remained strong because the asset inflation of stocks and homes also buoyed net worth.
So there we were: Surging assets and surging debt, with net worth surging, too. What went wrong? The downfall began when the housing bubble burst and gathered speed when the erosion of home values began to pull down stocks. As home values and stock-market values withered, so did net worth. But debt remained. So now the ratios – cash to debt and net worth to debt – shrank, and we became bad prospects for additional loans. Lenders don’t like to provide additional credit to folks with bad balance-sheet ratios.
Problem was, our borrowing supported the spending that had grown the economy. Less borrowing and spending led to recession. As employment opportunities withered, our willingness to take on more debt – in order to support more spending – also withered. We became concerned with our balance-sheet ratios and wanted more cash and less debt. But shunning debt and cutting spending made the recession worse.
So now we’re locked in a downward spiral of debt and expenditure reduction, trying desperately to reorient our cash-debt and net worth-debt ratios. Who will borrow and spend?
That’s where Uncle Sam comes in. Or economy has grown to depend upon borrowing to support its spending. As private borrowing and spending recedes, public borrowing and spending must take its place.
Question is: Will it be enough as households adjourn to the sidelines and mend their balance-sheet ratios?
© 2009 Michael B. Lehmann
Thursday, February 19, 2009
The Fed’s Forecast
The Lehmann Letter ®
On February 18 the Federal Reserve released the most recent minutes of the Fed’s Open Market Committee, which sets the federal funds rate:
http://www.federalreserve.gov/newsevents/press/monetary/fomcminutes20090128.pdf
The Fed’s near-term projection has become increasingly gloomy, with a consensus that the economy will shrink in 2009. The forecast concluded, however, that recovery would begin in the second half of 2009 in response to expansionary monetary and fiscal policies.
“Participants’ projections for the change in real GDP in
2009 had a central tendency of -1.3 to -0.5 percent,
compared with the central tendency of -0.2 to 1.1 percent
for their projections last October. In explaining
these downward revisions, participants referred to the
further intensification of the financial crisis and its effect
on credit and wealth, the waning of consumer and
business confidence, the marked deceleration in global
economic activity, and the weakness of incoming data
on spending and employment. Participants anticipated
a broad-based decline in aggregate output during the
first half of this year; they noted that consumer spending
would likely be damped by the deterioration in labor
markets, the tightness of credit conditions, the continuing
decline in house prices, and the recent sharp
reduction in stock market wealth, and they saw reductions
in consumer demand contributing to further
weakness in business investment. However, participants
expected that the economy would begin to recover—
albeit gradually—during the second half of the
year, mainly reflecting the effects of fiscal stimulus and
of Federal Reserve measures providing support to
credit markets.”
The Fed is not in the business of needlessly raining on anyone’s parade. If it says the recession appears worse now than last fall, you can believe it.
© 2009 Michael B. Lehmann
Wednesday, February 18, 2009
The President’s Housing Plan
The Lehmann Letter ®
President Obama today announced his housing-recovery plan. It provides mortgage lenders and servicers with incentives to modify mortgage-loan terms to help struggling homeowners avoid foreclosure. Will it work? We’ll see. The key question: Is it large enough and sufficiently drastic to substantially mitigate the wave of foreclosures?
Those who wanted more may be disappointed. They asked for: (1) A foreclosure moratorium that calls a halt to all foreclosures for a specified period of time. (2) A “cramdown” of loan terms to keep all those at risk of foreclosure in their homes. The cramdown could include principal reduction, interest-rate reduction and a longer loan term, or all of the above. (3) A federal bank-bailout to save harmless those banks that suffered cramdowns. These steps go beyond what the president requested and may be more than Congress would authorize.
In any event, all would agree the president’s plan goes well beyond the bank-sponsored programs now in place. These have accomplished little.
Meanwhile, the Census Bureau today announced that housing starts fell to 166,000 in January. Connect that dot to the chart below (it’s beneath the chart’s base line) and you will see that this slump is worse than all others since WWII.
Housing Starts
(Click on chart to enlarge)

© 2009 Michael B. Lehmann
President Obama today announced his housing-recovery plan. It provides mortgage lenders and servicers with incentives to modify mortgage-loan terms to help struggling homeowners avoid foreclosure. Will it work? We’ll see. The key question: Is it large enough and sufficiently drastic to substantially mitigate the wave of foreclosures?
Those who wanted more may be disappointed. They asked for: (1) A foreclosure moratorium that calls a halt to all foreclosures for a specified period of time. (2) A “cramdown” of loan terms to keep all those at risk of foreclosure in their homes. The cramdown could include principal reduction, interest-rate reduction and a longer loan term, or all of the above. (3) A federal bank-bailout to save harmless those banks that suffered cramdowns. These steps go beyond what the president requested and may be more than Congress would authorize.
In any event, all would agree the president’s plan goes well beyond the bank-sponsored programs now in place. These have accomplished little.
Meanwhile, the Census Bureau today announced that housing starts fell to 166,000 in January. Connect that dot to the chart below (it’s beneath the chart’s base line) and you will see that this slump is worse than all others since WWII.
Housing Starts
(Click on chart to enlarge)

(Recessions shaded)
Housing’s collapse is ground zero for the current economic crisis. The problem started here and must end here. Until this downward spiral stops, there can’t be much of a recovery.
Let’s hope the president’s plan is sufficiently robust to turn the corner.
(The chart was taken from http://www.beyourowneconomist.com. [Click on Seminars and then Charts.] Go there for additional charts on the economy and a list of economic indicators.)
© 2009 Michael B. Lehmann
Tuesday, February 17, 2009
Involuntary Inventory Accumulation: Still A Problem
The Lehmann Letter ©
On Thursday the Census Bureau released December data for business sales, inventories and the inventory/sales ratio: http://www.census.gov/mtis/www/mtis_current.html
The Bureau said that inventories had risen by 0.9 percent while sales were down 11.8 percent from a year earlier. Consequently, the inventory/sales ratio (sales divided by inventories) climbed from 1.26 to 1.44 (see following chart).
(Click on image to enlarge,)

To repeat what this blog said a month ago:
The recent rise interrupted the long-run downward trend. Over the past decade businesses have required fewer and fewer inventories to support their sales. That was a measure of improved efficiency.
But the ratio’s recent rise is ominous because it’s a symptom of involuntary inventory accumulation. If sales fall and inventories rise – as they have over the past year – that’s a sign that unsold goods are piling up on shelves. Businesses have not been able to reduce production and orders swiftly enough to prevent the involuntary accumulation of unsold goods. In other words, the drop in sales was worse than business anticipated and caught business by surprise. Hence: Involuntary inventory accumulation – the buildup of unwanted product.
Management’s solution: Production reduction as firms sell off their inventories rather than produce more product. Inventories must fall more rapidly than sales in order to return the inventory/sales ratio to the normal range. To accomplish that, production must also fall more rapidly than sales.
Business will, of course, eventually be able to bring its inventories under control. But, in a world of declining sales volume, that implies a drastic reduction in output and orders. When the ratio stops rising and begins to fall, the recessions full downdraft will be upon us.
That’s not a comforting prospect.
© 2009 Michael B. Lehmann
Friday, February 13, 2009
FDR & Barack
The Lehmann Letter ©
We all know there are many in Congress who oppose the stimulus package.
There are also many who support the concept but say the package is too small.
The supporters should take heart and recall the argument over whether or not the New Deal or WWII brought an end to the Great Depression. That argument is shaped by the New Deal’s detractors who say that the New Deal was not effective because the war – not the New Deal - restored full employment. That’s true, but it’s a non sequitur to draw the conclusion that the New Deal was misguided. The proper conclusion is that the New Deal’s public-works projects and deficit spending were well conceived but too small. If only those projects and deficits had been on WWII’s massive scale, the Great Depression might have ended 10 years earlier.
Similarly, President Obama’s stimulus package would be more effective if it was larger. But the political realities of the day dictated its size. That doesn’t mean it won’t do good, and it certainly doesn’t mean that the stimulus is misguided. Just as FDR’s New Deal was the best that could be mobilized under the constraints of that day, reality also constrains what President Obama can do. The stimulus will help even if we wish it was larger so it could do more.
© 2009 Michael B. Lehmann
Thursday, February 12, 2009
The Stimulus Package
The Lehmann Letter ©
It looks like the stimulus package will become law.
That’s good, because we could use some good news.
Is it ideal? No. There are more than enough critics and criticisms. But it is a start and, more important, it’s the best that could be done under the circumstances. After all, 61 votes is a slim margin in today’s Senate.
Meanwhile, here are some thoughts about some of the criticisms.
First, there’s what we will spend the money on. The conventional wisdom says infrastructure, what we used to call public works. But it really doesn’t matter, as long as it happens sooner rather than later. Spending is spending. Health care and education are just as good as roads and bridges because both create jobs. And that’s the objective. If you prefer roads and bridges to health care and education, that’s OK. But that’s not the same as saying health care and education don’t create jobs.
Second, some of the criticism is about small numbers. You may think spending money to re-sod the nation’s capital is a waste, and maybe you are right. But that was a small part of the total. As a matter of fact, if you add all the spending on the specific projects that have suffered the most ridicule, you probably won’t come up with more than a few $billion. That’s relatively little out of a $700 or $800 billion total.
Third, contrary to the critics, it really is this plan or nothing. It’s not accurate to say that there are other plans that could have been enacted that would have been more effective. They may have been more effective, but that doesn’t mean they could have been enacted. The final package was a delicate balance of competing interests and multiple compromises. There is no way some features not in the package could have replaced other features that are in the package. That would have reduced the “yes” votes and increased the “no” votes and the package would have come apart. A package deal is a package deal. It’s all or nothing. And there was no alternative package that could have garnered the necessary votes.
© 2009 Michael B. Lehmann
Monday, February 9, 2009
The President’s Press Conference
The Lehmann Letter ©
At this evening’s press conference President Obama clearly stated his position and his policy.
An economic crisis confronts us: A crisis so severe that it requires a drastic and a prompt response. And the economic stimulus package that will emerge from Congress and that the President will sign is the best response under all the circumstances.
The House Democrats want more, but there is no way they can get more.
The House Republicans want less, but they fail to understand that Reaganomics is not appropriate.
The Senate Democrats have their eye on the prize, but can’t obtain the prize on their own. They need help.
The Senate Republicans……. See comments on House Republicans above.
The Senate Centrists (Democrats and Republicans) see the big picture and will do what it takes to pass the measure.
The President is wise enough to know that half-a-loaf is better than none. He won’t hold out for the ideal and thereby lose an opportunity to obtain the good.
© 2009 Michael B. Lehmann
Friday, February 6, 2009
-598,000
The Lehmann Letter ©
The Bureau of Labor Statistics’ crafts its employment reports to convey data, not drama. But today’s report does both (http://stats.bls.gov/news.release/empsit.nr0.htm ):
“Nonfarm payroll employment fell sharply in January (-598,000) and the unemployment rate rose from 7.2 to 7.6 percent, the Bureau of Labor Statistics of the U.S. Department of Labor reported today. Payroll employment has declined by 3.6 million since the start of the recession in December 2007; about one-half of this decline occurred in the past 3 months. In January, job losseswere large and widespread across nearly all major industry sectors.”
If we continue to lose half-a-million jobs a month – or more – we will soon reach a double-digit unemployment rate.
Job Growth and Losses
(Click on chart to enlarge)

Recessions shaded
The chart illustrates the crisis’s severity. We haven’t seen job losses in excess of 500,000 per month since the 1974 recession. The chart also shows that losses on that scale during earlier recessions were brief – narrow stalactites. The current signs point to hardship of longer duration.
That’s why passage of the stimulus bill is so urgent.
© 2009 Michael B. Lehmann
Wednesday, February 4, 2009
9.5 Million
The Lehmann Letter ©
The Bureau of Economic Analysis today released its report on January motor-vehicle sales.
You can obtain the report and the latest data by:
Step 1: Click on http://www.bea.gov/
Step 2: Click on "Gross Domestic Product" under "National"
Step 3: Scroll down and click on "Motor Vehicles" under "Supplemental Estimates"
Step 4: Save to your desktop as an Excel file and then open the file
Step 5: Click on the "Table 6" tab at the bottom of the page
Step 6: Look at column I (Light Total) and scroll down for the latest data
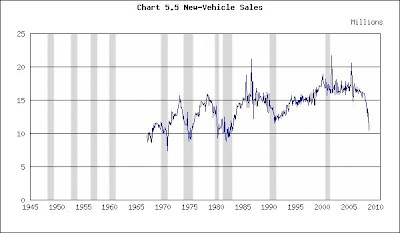
If you examine the data, you’ll see that 9.5 million new vehicles were sold in January at a seasonally-adjusted annual rate. Put that figure in perspective by using it to update the following chart.
New-Vehicle Sales
(Click on chart to enlarge)
The Bureau of Economic Analysis today released its report on January motor-vehicle sales.
You can obtain the report and the latest data by:
Step 1: Click on http://www.bea.gov/
Step 2: Click on "Gross Domestic Product" under "National"
Step 3: Scroll down and click on "Motor Vehicles" under "Supplemental Estimates"
Step 4: Save to your desktop as an Excel file and then open the file
Step 5: Click on the "Table 6" tab at the bottom of the page
Step 6: Look at column I (Light Total) and scroll down for the latest data
If you examine the data, you’ll see that 9.5 million new vehicles were sold in January at a seasonally-adjusted annual rate. Put that figure in perspective by using it to update the following chart.
New-Vehicle Sales
(Click on chart to enlarge)

Recessions shaded
Sales are now little more than half the level that had been customary earlier in the decade. It’s been 25 years since sales were below 10 million. And, as you can see, at no time over the past 40 years have new-vehicle sales fallen substantially below 10 million for any length of time. Should sales continue to drop and not recover soon, the industry will have a disaster on its hands.
But it’s not just the auto industry that is at risk. Think of the steel, glass, upholstery and rubber tires that are incorporated in the finished product. Think of the myriad parts and sub-assemblies included in engines, suspensions, braking systems and electrical systems, many purchased from legions of suppliers. The fortunes of an entire bloc of industries rises and falls with new-vehicle sales.
The latest data emphasize the urgent need for an auto-industry rescue package. They also highlight the dire straits in which the entire economy finds itself.
© 2009 Michael B. Lehmann
Tuesday, February 3, 2009
Pending Home Sales
The Lehmann Letter ©
Today’s report on pending home sales (http://www.realtor.org/press_room/news_releases/2009/02/pending_home_sales_show_healthy_gain ) by the National Association of Realtors is moderately upbeat:
“Pending home sales increased as more buyers took advantage of improved affordability conditions, according to the National Association of Realtors®. Big gains in the South and Midwest offset modest declines in other regions.
“The Pending Home Sales Index, a forward-looking indicator based on contracts signed in December, rose 6.3 percent to 87.7 from an upwardly revised reading of 82.5 in November, and is 2.1 percent higher than December 2007 when it was 85.9.
“Lawrence Yun, NAR chief economist, said the index shows a modest rebound. “The monthly gain in pending home sales, spurred by buyers responding to lower home prices and mortgage interest rates, more than offset an index decline in the previous month,” he said. “The biggest gains were in areas with the biggest improvements in affordability.”
“NAR’s Housing Affordability index rose 10.9 percent in December to 158.8, the highest on record.2 The HAI shows that the relationship between home prices, mortgage interest rates and family income is the most favorable since tracking began in 1970.
“”Significant uncertainty still clouds the housing market despite improved affordability conditions. For a sustainable housing market recovery and, hence, sustainable economic recovery, we need a significant housing stimulus and mortgage availability for qualified borrowers,” Yun added.”
Unfortunately, the pending home sales’ index fluctuated between 83.0 and 93.5 over the past year, so December’s 87.7 number is hardly red hot. There is no upward trend.
But the press release’s announcement that housing affordability is now higher than at any time since 1970 is sad. Home sales and building remain in the ditch despite a strong combination of low home prices and mortgage interest rates relative to household income (i.e. top affordability). The housing market remains in the throes of a severe asset deflation. Home prices continue to tumble because potential buyers hold back in the belief that prices will fall further. This aids and abets the foreclosure crisis. It’s tough to build and buy in that climate.
What could shake the malaise? A foreclosure amnesty + legislation that gave the courts the right to re-write mortgage contracts in household-bankruptcy proceedings + legislation that assisted banks whose mortgage assets had been written-down in those proceedings. That would do more than anything to stop the foreclosures and the asset deflation and stabilize home prices. Then new-home sales and building could begin to recover.
© 2009 Michael B. Lehmann
Subscribe to:
Posts (Atom)