The Lehmann Letter (C)
The blogger will return after the New Year.
Happy Holidays to one and all!
Thursday, December 18, 2008
Tuesday, December 16, 2008
Fed Funds Flattened
THE BE YOUR OWN ECONOMIST ® BLOG
The Lehmann Letter ©
Today the Federal Reserve reduced its federal-funds-rate target to between 0% and ¼%. You can read the Fed’s press release at:
http://www.federalreserve.gov/newsevents/press/monetary/20081216b.htm .
Direct your attention to these key passages:
“Since the Committee's last meeting, labor market conditions have deteriorated, and the available data indicate that consumer spending, business investment, and industrial production have declined. Financial markets remain quite strained and credit conditions tight. Overall, the outlook for economic activity has weakened further……
“The Federal Reserve will employ all available tools to promote the resumption of sustainable economic growth and to preserve price stability. In particular, the Committee anticipates that weak economic conditions are likely to warrant exceptionally low levels of the federal funds rate for some time…….. “
The patient is in intensive care and the Fed is administering its strongest medicine. Will it work?
We’ll see. The Fed’s efforts are certainly superior to maintaining high interest rates in the face of the economy’s collapse. But will rock-bottom interest rates actively promote recovery?
During the 2000-2002 dot-com bust the Fed also promoted interest-rates’ decline. Fortunately housing and autos responded favorably to these cuts, remained strong, and then blossomed by rising to sustained levels not seen before. Unfortunately we know how that story ended. Housing collapsed under its own bloated weight and dragged autos down with it. Falling interest rates have not yet resurrect these key sectors.
During earlier business cycles, in the 1960s and 1970s, a surging economy – booming housing and autos - ignited inflation and rising interest rates. Higher prices and higher borrowing costs choked-off the boom – slumping housing and autos - and led to recession. But these slumps were self-correcting because recession’s depressed conditions reduced inflation and interest rates, thereby reigniting – housing and autos - economic growth.
The economy behaved like a frisky horse in these earlier cycles, charging ahead when the reins were dropped and coming to a dead stop when reined in.
Today the reins are dangling to the ground. Inflation has disappeared and the federal-funds rate is negligible. Will the horse once again feel his oats?
Stay tuned. There are reasons to believe that this time is different because the bursting of the housing bubble has no analogy in earlier recessions. No one pulled back on the reins this time. Instead, the horse ran himself ragged. It will take a while for him to regain his strength.
© 2008 Michael B. Lehmann
Monday, December 15, 2008
Liquidity Trap
THE BE YOUR OWN ECONOMIST ® BLOG
The Lehmann Letter ©
In his 1936 “General Theory Of Employment, Interest and Money,” John Maynard Keynes discussed what he called the liquidity trap. The trap occurred when demand had pushed bond prices – think U.S. Treasury securities – so high that they could rise no further. At that point, in an economy awash in liquidity, interest rates hit rock bottom at barely above zero.
Keep in mind that bond prices and interest rates very inversely. Let’s say a 30-year bond sells for $1,000 and pays $50 annual interest for a 5% yield. If at any time in those 30 years the bond’s purchaser sells the bond, the change in the bond’s price will determine the rate of interest (yield) because the bond always pays $50 annually. For instance, if heavy demand for the bond pushed its price up to $2,000, then the yield would be roughly 2-1/2% ($50/$2,000 = 2-1/2%). If weak demand reduced the bond’s price to $500, then the yield would have risen to roughly 10% ($50/$500 = 10%).
In a weak economy, said Mr. Keynes, businesses had excess funds because of the dearth of projects in which to invest those funds. These circumstances prompted businesses to purchase bonds with their excess funds in order to earn a return on those funds. Unfortunately, excess liquidity could prompt massive demand for bonds, pushing their prices upward and their yield downward. Since the yield could not fall below zero, that set an upward boundary on bond prices.
When bond prices reached their maximum and bond yields dipped to their minimum, the economy was in the liquidity trap. The trap rendered monetary policy useless because the central bank could not further depress interest rates in order to implement an expansionary monetary policy. If business required lower rates before it purchased more plant and equipment, business would be disappointed. Rates could not fall and therefore business investment would not rise. The economy was stuck in the trap.
Our economy may be in, or close to, a liquidity trap today. Yields on some Treasury securities have briefly fallen to zero. The Federal Reserve is contemplating a drop in the federal-funds rate to less than 1%. Will this prompt business to invest more (purchase additional plant and equipment)? Probably not. Will households buy more homes and cars? That remains to be seen. The direction of home prices and employment will play an important role.
If the economy is caught in a liquidity trap, traditional monetary policy can have little effect.
© 2008 Michael B. Lehmann
Friday, December 12, 2008
Deflation’s Root
THE BE YOUR OWN ECONOMIST ® BLOG
The Lehmann Letter ©
Yesterday the Federal Reserve released its third-quarter 2008 flow-of-funds report. Households’ $117.4 billion reduction in outstanding debt caught the attention of many. Consumers are pulling back.
But there was another aspect of the report that generated less attention. To review the numbers for yourself, go to (http://www.federalreserve.gov/releases/z1/Current/z1r-2.pdf).
Calculate total private nonfinancial borrowing by subtracting federal borrowing from the total for all domestic nonfinancial sectors and then adding foreign borrowing. You should arrive at these totals for 2008.
2008
First Quarter $1,555.0 Billion
Second Quarter $772.0 Billion
Third Quarter -$277.7 Billion
The following chart is current through the second quarter. Update the chart in your mind’s eye by including the third quarter drop of -$277.7 billion.
Private Borrowing
(Click on chart to enlarge)

(The chart was taken from http://www.beyourowneconomist.com. [Click on Seminars and then Charts.] Go there for additional charts on the economy and a list of economic indicators.)
© 2008 Michael B. Lehmann
The Lehmann Letter ©
Yesterday the Federal Reserve released its third-quarter 2008 flow-of-funds report. Households’ $117.4 billion reduction in outstanding debt caught the attention of many. Consumers are pulling back.
But there was another aspect of the report that generated less attention. To review the numbers for yourself, go to (http://www.federalreserve.gov/releases/z1/Current/z1r-2.pdf).
Calculate total private nonfinancial borrowing by subtracting federal borrowing from the total for all domestic nonfinancial sectors and then adding foreign borrowing. You should arrive at these totals for 2008.
2008
First Quarter $1,555.0 Billion
Second Quarter $772.0 Billion
Third Quarter -$277.7 Billion
The following chart is current through the second quarter. Update the chart in your mind’s eye by including the third quarter drop of -$277.7 billion.
Private Borrowing
(Click on chart to enlarge)

(Recessions shaded)
This is the first time that private borrowing was negative. That is, the private sector is repaying its debts rather than incurring new debt. So what, you might say. Isn’t it about time the borrowing binge came to an end?
Not so fast. Borrowing supports spending. The surge in household and business indebtedness since 1990 financed the growth in aggregate demand. Mortgage borrowing’s support of residential construction is the most clear cut example, but not the only one. And borrowing’s current collapse is, of course, an obvious sign of the current recession’s seriousness.
Moreover, borrowing’s collapse is also an omen of impending deflation. It’s difficult to maintain prices when demand’s most important prop – borrowing – disappears.
(The chart was taken from http://www.beyourowneconomist.com. [Click on Seminars and then Charts.] Go there for additional charts on the economy and a list of economic indicators.)
© 2008 Michael B. Lehmann
Wednesday, December 10, 2008
Consumer Credit
THE BE YOUR OWN ECONOMIST ® BLOG
The Lehmann Letter ©
Today the nation closely followed news of the auto-industry rescue package.
Last Friday, December 5th, the Federal Reserve released its consumer-credit report (http://www.federalreserve.gov/releases/g19/Current/). These data have a direct bearing on the auto industry’s problems because consumers borrow heavily to finance motor-vehicle purchases.
You can see from the chart below that consumer credit has grown by about $100 billion a month for the last five years. But the most recent entry spiked downward. Was this an aberration?
Consumer Credit
(Click on chart to enlarge)

Recessions shaded
It’s too early to tell.
The Fed publishes historical data (http://www.federalreserve.gov/releases/g19/hist/cc_hist_sa.html ) that lets you calculate recent changes. Just subtract one month from the next and multiply by 12 to estimate an annual rate.
Here are the most recent figures.
July = +$88.0 billion
Aug = -$77.1 billion
Sep = +$80.8 billion
Oct = -$42.4 billion
You can see that September bounced back from August’s negative reading. Then October slipped below zero again. Over the last few months the reading’s average has been barely positive, not close to the $100 billion average of the last five years.
The credit crisis explains part of the decline. Borrowers have increasing difficulty qualifying for auto loans. But that’s not the whole story. Households are less likely to borrow and spend when they feel pessimistic. And recently consumer confidence has fallen dramatically. That may also be responsible for the recent slippage in these numbers.
Stay tuned to this statistic to see whether or not it continues to provide a signal of economic weakness.
(The chart was taken from http://www.beyourowneconomist.com. [Click on Seminars and then Charts.] Go there for additional charts on the economy and a list of economic indicators.)
© 2008 Michael B. Lehmann
Monday, December 8, 2008
Obama Has It Right
THE BE YOUR OWN ECONOMIST ® BLOG
The Lehmann Letter ©
Today’s news reported that President-elect Obama favors a massive public-works program to boost aggregate demand and employment, a rescue for Detroit to avoid the risk of bankruptcy for the Big Three and expanded relief for homeowners facing foreclosure.
Right on!
The American people have to believe that our government is taking the lead in fighting recession, not sitting on the sidelines. That’s key to boosting confidence and private expenditures. Small measures won’t do. Relief must be stunning and occur forthwith. A trillion dollars is a good start. There’s much to be done. And why risk the damage of auto-company bankruptcies? Detroit can be assisted and restructured. It’s not one or the other. Finally, why should one more homeowner face immediate foreclosure? The new president should stop the foreclosures and institute an aggressive homeowner-rescue plan. Some homes will inevitably face foreclosure no matter what is done. But why let the value of out neighborhoods be dragged down any more than is absolutely necessary?
© 2008 Michael B. Lehmann
Friday, December 5, 2008
The Crisis Deepens
THE BE YOUR OWN ECONOMIST ® BLOG
The Lehmann Letter ©
This morning’s employment report from the Bureau of Labor Statistics is alarming (http://stats.bls.gov/news.release/empsit.nr0.htm):
“Nonfarm payroll employment fell sharply (-533,000) in November, and
the unemployment rate rose from 6.5 to 6.7 percent, the Bureau of Labor
Statistics of the U.S. Department of Labor reported today. November's
drop in payroll employment followed declines of 403,000 in September and
320,000 in October, as revised. Job losses were large and widespread
across the major industry sectors in November.”
November’s job loss – 533,000 – signals deep recession. So does the upward revision of the September and October figures to 403,000 and 320,000 respectively. Details of the report are equally grim. Only education and health services (+52,000) and government (+9,000) added jobs. All other sectors shed workers. The sharp drop in overall service employment (370,000) was especially eye-catching. This slump is not confined to construction and manufacturing.
When will the administration step in and stop the bleeding? A lower interest rate for home-buyers is good. A foreclosure moratorium for homeowners, together with a generous refinance package for those at risk of losing their homes, would be better. It’s hard to envision a successful recovery program that fails to include real-estate stabilization.
© 2008 Michael B. Lehmann
Wednesday, December 3, 2008
December Publication Schedule & Web Sources
THE BE YOUR OWN ECONOMIST ® BLOG
The Lehmann Letter ©
You can use the WEB SOURCES listing (below) to find the data on your own and read the accompanying press release. The addresses take you to the source’s home page and the steps tell you how to navigate the site. That way (rather than provide a direct link to the data) you can become familiar with these sites and find additional information on your own.
PUBLICATION SCHEDULE
December 2008
Source (* below)…………Series Description…………Day & Date
Quarterly Data
BLS……………………….Productivity………………..….Wed, 3rd
BEA……………International transactions………….Wed, 17th
BEA…………………………GDP…………………….....……Tue, 23rd
Monthly Data
ISM………………….Purchasing managers’ index……….Mon, 1st
Fed…………………………..Consumer credit………..…….Fri, 5th
BLS………………………….Employment………………… Fri, 5th
Census……………………...Balance of trade………………Thu, 11th
BLS………………………….Producer prices……………….Fri, 12th
Census……………………...Retail trade…………………….Fri, 12th
Census……………………...Inventories……………………..Fri, 12th
Fed…………………………..Industrial production………….Mon, 15th
Fed………………………….Capacity utilization…………….Mon, 15th
BLS………………………….Consumer prices……………...Tue, 16th
Census……………………..Housing starts………………….Tue, 16th
Conf Bd…………………….Leading indicators…………….Thu, 18th
Census……………………..New-home sales……………….Tue, 23rd
NAR…………………………Existing-home sales…….…….Tue, 23rd
Census…………………….Capital goods……………….…..Wed, 24th
Conf Bd…………………….Consumer confidence…………Tue, 30th
* BEA = Bureau of Economic Analysis of the U.S. Department of Commerce
* BLS = Bureau of Labor Statistics of the U.S. Department of Labor
* Census = U.S. Bureau of the Census
* Conf Bd = Conference Board
* Fed = Federal Reserve System
* ISM = Institute for Supply Management
* NAR = National Association of Realtors
WEB SOURCES
Index of Leading Economic Indicators: http://www.conference-board.org/..........
Step 1: Click on "Economics" in the left-hand menu bar…………………………………….
Step 2: Click on "Economic Indicators" under "Economics" in the left-hand menu bar………………………………………………………………………………………………………………..
Step 3: Click on link under "U.S. Leading Indicators"………………………………………
Gross Domestic Product: http://www.bea.gov/....................................................
Step 1: Click on "Gross Domestic Product" under "National"………………………….
Step 2: Click on "National Income and Product Accounts Tables" under "Gross Domestic Product (GDP)"……………………………………………………………………………
Step 3: Click on "list of all NIPA Tables"………………………………………………………….
Step 4: Click on "Table 1.1.6. Real Gross Domestic Product..." and "Table 1.1.1. Percent Change..."……………………………………………………………………………………….
Step 5: Scroll down to line 1 in both tables and go to the last column on the right
Industrial Production & Capacity Utilization: http://www.federalreserve.gov/
Step 1: Click on "All Statistical Releases" under "Recent Statistical Releases" and then click on "Industrial Production and Capacity Utilization" under "Principal Economic Indicators" in the upper left…………………………………………………………
Step 2: Find the latest monthly data in the table next to "Total index" and "Total industry"……………………………………………………………………………………………………..
Institute For Supply Management Index: http://www.ism.ws/ ……………………….
Step 1: Click on "ISM Report on Business" in left-hand menu bar……………………
Step 2: Click on “Latest Manufacturing ROB” and find the latest PMI…………….
Producer Prices: http://stats.bls.gov/.....................................................................
Step 1: Click on “Producer Price Indexes” under “Inflation & Consumer Spending” in left-hand menu bar………………………………………………………………….
Step 2: Note "Finished goods" under "Latest Numbers" in upper right and multiply by 12 to put the data on an annual basis……………………………………….
Business Capital Expenditures (Nondefense Capital Goods): http://www.census.gov/ ………………………………………………………………………………..
Step 1: Click on "Economic Indicators" in the lower right…………………………………
Step 2: Click on "PDF" on the left under "Advance Report on Durable Goods Manufacturers' Shipments and Orders"…………………………………………………………..
Step 3: Scroll down to Table 1 and find new orders for nondefense capital goods near the bottom……………………………………………………………………………………………..
Inventories, Sales & Inventory/Sales Ratio: http://www.census.gov/
Step 1: Click on "Economic Indicators" in the lower right…………………………………
Step 2: Click on "HTML" on the left under "Manufacturing and Trade Inventories and Sales" ………………………………………………………………………………………………
Step 3: Scroll down to Table 1 and subtract previous month's inventories from latest month's and multiply by 12 to obtain inventory change, and then obtain the most recent inventory/sales ratio……………………………………………………………………
Consumer Price Index: http://stats.bls.gov/...........................................................
Step 1: Click on “Consumer Price Index” under “Inflation & Consumer Spending” in left-hand menu bar………………………………………………………………………………….
Step 2: Note "CPI-U..." at the top under "Latest Numbers" in upper right and multiply "SA" by 12 to put the data on an annual basis…………………………………..
Employment Data (Total Non-farm Payroll Employment) (Unemployment Rate) (Manufacturing Workweek): http://stats.bls.gov/ ………………………………………..
Step 1: Click on “National Employment” under “Employment & Unemployment” in right-hand menu bar………………………………………………………………………………
Step 2: Click on (HTML) following “Employment Situation Summary” under "Economic News Releases"……………………………………………………………………….
Step 3: Click on “Employment Situation Summary” under “Table of Contents”
Step 4: Scroll down to Table A and find the unemployment rate for all workers in the latest month, the change in nonfarm employment in the last column and manufacturing hours of work for the latest month…………………………………………..
Personal Income: http://www.bea.gov/.....................................................................
Step 1: Click on "Gross Domestic Product" under "National"……………………………..
Step 2: Click on "National Income and Product Accounts Tables" under "Gross Domestic Product (GDP)"…………………………………………………………………………….
Step 3: Click on "list of all NIPA Tables"……………………………………………………….
Step 4: Click on "Table 2.6 Personal Income..."…………………………………………………
Step 5: Scroll down to line 1…………………………………………………………………………..
Consumer Confidence: http://www.conference-board.org/....................................
Step 1: Click on the "Economics" in the left-hand menu bar……………………………….
Step 2: Click on "Economic Indicators" under "Economics" in the left-hand menu bar………………………………………………………………………………………………………………..
Step 3: Click on link under "Consumer Confidence Index"…………………………………
Consumer Credit: http://www.federalreserve.gov/...................................................
Step 1: Click on "All Statistical Releases" under "Recent Statistical Releases" and then click on "Consumer credit -- G19" under "Household Finance" in the upper right…………………………………………………………………………………………………………..
Step 2: Click on "Current Release"…………………………………………………………………
Step 3: Go to "Amount ... billions of dollars" and subtract previous month from current month & multiply by 12 to obtain seasonally adjusted dollar amount at annual rate………………………………………………………………………………………………..
Housing Starts: http://www.census.gov/..................................................................
Step 1: Click on "Economic Indicators" in the lower right………………………………….
Step 2: Click on "PDF" on the left under "Current Press Release" under "Housing Starts/Building Permits"………………………………………………………………………………..
Step 3: Scroll down to "Housing Starts"…………………………………………………………..
Home Sales (Existing-Home Sales): http://www.realtor.org/.................................
Step 1: Click on "Research" in the left-hand menu bar……………………………………….
Step 2: Find "Existing-Home Sales" under "Housing Indicators"……………………..
Home Sales (New-Home Sales): http://www.census.gov/.......................................
Step 1: Click on "Economic Indicators" in the lower right………………………………..
Step 2: Click on "PDF" on the left under "Current Press Release" under "New Home Sales"………………………………………………………………………………………………….
Retail Sales: http://www.census.gov/.......................................................................
Step 1: Click on "Economic Indicators" in the lower right…………………………………..
Step 2: Scroll down to "Advance Monthly Sales for Retail and Food Services" and click on "HTML" on the left under "Current Press Release"………………………………
© 2008 Michael B. Lehmann
Tuesday, December 2, 2008
Autos and Manufacturing
THE BE YOUR OWN ECONOMIST ® BLOG
The Lehmann Letter ©
The Big Three are testifying before Congress again, trying to make their case for a bailout. Maybe they’ll succeed.
But there is something everyone can agree on: The automobile industry and all manufacturing are in trouble.
November new-vehicle sales were 10.1 million at a seasonally-adjusted annual rate. See where that is on the chart below. Is there any wonder that the industry is in crisis?
New-Vehicle Sales
(Click on chart to enlarge)

Recessions shaded
Yesterday the Institute for Supply Management said the Purchasing Managers’ Index fell to 36.2 in November (http://www.ism.ws/ ). In the chart below you need to go back to 1980 for a lower reading. The auto industry is a reflection of what is happening throughout manufacturing. Or vice versa.
Purchasing Managers’ Index
(Click on chart to enlarge)

Recessions shaded
In a couple of weeks the Fed will release its industrial production and capacity-utilization data. We’ll see if they, too, confirm these grim trends.
(The charts are taken from http://www.beyourowneconomist.com. [Click on Seminars and then Charts.] Go there for additional charts on the economy and a list of economic indicators.)
© 2008 Michael B. Lehmann
Monday, December 1, 2008
It’s Official
THE BE YOUR OWN ECONOMIST ® BLOG
The Lehmann Letter ©
Today the National Bureau of Economic Research announced (http://wwwdev.nber.org/cycles/dec2008.html) that “…a peak in economic activity occurred in the U.S. economy in December 2007. The peak marks the end of the expansion that began in November 2001 and the beginning of a recession. The expansion lasted 73 months; the previous expansion of the 1990s lasted 120 months.”
So there you have it. It’s official. We’re in a recession and have been for a year, despite the Bush administration’s reluctance to pin a tail on that donkey.
The Bureau justified its position by defining recession and employment’s key role in determining whether or not the economy is in recession:
“A recession is a significant decline in economic activity spread across the economy, lasting more than a few months, normally visible in production, employment, real income, and other indicators. A recession begins when the economy reaches a peak of activity and ends when the economy reaches its trough. Between trough and peak, the economy is in an expansion.
“Because a recession is a broad contraction of the economy, not confined to one sector, the committee emphasizes economy-wide measures of economic activity. The committee believes that domestic production and employment are the primary conceptual measures of economic activity.
“The committee views the payroll employment measure, which is based on a large survey of employers, as the most reliable comprehensive estimate of employment. This series reached a peak in December 2007 and has declined every month since then.”
“The Bureau believes that the decline in employment is the best evidence of recession.”
How long will the recession last?
Let’s ask Federal Reserve chairman Ben Bernanke. In a speech delivered today (http://www.federalreserve.gov/newsevents/speech/bernanke20081201a.htm) he said, “…the U.S. economy remains under considerable stress. …economic activity appears to have downshifted further in the wake of the deterioration in financial conditions in September…economic conditions will probably remain weak for a time. In particular, household spending likely will continue to be depressed by the declines to date in household wealth, cumulating job losses, weak consumer confidence, and a lack of credit availability.
“The global economy has also slowed. Many industrial countries were affected by the financial crisis from the beginning, but the latest economic data point to a more noticeable weakening of conditions. And emerging market economies, which were little affected at first, are slowing now as well. One implication of these developments is that exports are not likely to be as great a source of strength for U.S. economic activity in coming quarters as they had been earlier this year."
This recession will be a long one. It’s already a year old and there’s no end in sight. Quite to the contrary, it appears that conditions will deteriorate further before they improve.
Will this recession be the worst recession since the Great Depression of the 1930s? For that to occur, using unemployment as the single gauge, the unemployment rate would have to exceed (slightly more than) 10%, the level it reached during the 1981-82 recession. In October the unemployment rate was 6.5%. We have a ways to go. Let’s hope we don’t arrive.
© 2008 Michael B. Lehmann
Wednesday, November 26, 2008
Swimming Upstream
THE BE YOUR OWN ECONOMIST ® BLOG
The Lehmann Letter ©
President-elect Obama is doing all he can to build confidence that his administration will hit the deck running on January 20, 2009. His economic team is in place and he has made clear that stimulating economic recovery, not deficit reduction or balancing the budget, is his first priority.
Good for him. Everyone wishes him well.
But the statistical news remains grim. Yesterday the Bureau of Economic Analysis (BEA) confirmed that GDP fell in the third quarter. The announcement also said (http://www.bea.gov/newsreleases/national/gdp/gdpnewsrelease.htm): “Profits from current production (corporate profits with inventory valuation and capital consumption adjustments) decreased $14.6 billion in the third quarter, compared with a decrease of$60.2 billion in the second quarter.” As a matter of fact, corporate profits were lower than at any time since the fourth quarter of 2005, almost three years ago.
The BEA also reported that consumption expenditures dropped by one percent in October (http://www.bea.gov/newsreleases/national/pi/pinewsrelease.htm): “Personal income increased $42.4 billion, or 0.3 percent, and disposable personal income (DPI) increased $45.1 billion, or 0.4 percent, in October, according to the Bureau of Economic Analysis. Personal consumption expenditures (PCE) decreased $102.8 billion, or 1.0 percent.” Despite income growth, consumers reduced spending. That’s a clear sign of the fear and uncertainty that grips households. They’d rather build their balance sheets than spend their income.
Today the Census Bureau released new-home sales data for October (http://www.census.gov/const/newressales.pdf): “Sales of new one-family houses in October 2008 were at a seasonally adjusted annual rate of 433,000, according to estimates released jointly today by the U.S. Census Bureau and the Department of Housing and Urban Development. This is 5.3 percent (±15.0%)* below the revised September of 457,000 and is 40.1 percent (±9.9%) below the October 2007 estimate of 723,000.”
Home sales are 40% below last year’s level and about a low as they were in the 1900-91 recession. Almost 20 years of gains are gone.
The Census Bureau also reported (http://www.census.gov/indicator/www/m3/adv/pdf/durgd.pdf): “New orders for manufactured durable goods in October decreased $12.7 billion or 6.2 percent to $193.0 billion, the U.S. Census Bureau announced today. This was the largest percent decrease in new orders since October 2006 and followed two consecutive monthly decreases including a 0.2 percent September decrease…..Nondefense new orders for capital goods in October
decreased $2.4 billion or 3.6 percent to $65.6 billion.”
Durable-good manufacturing has stalled, especially new orders for nondefense capital goods. This is a leading indicator of business capital expenditures.
There you have it: Profits, consumer spending and business capital expenditures are all down sharply. The new president is doing what he can to instill confidence in the forthcoming administration, but he’s clearly swimming upstream.
© 2008 Michael B. Lehmann
Tuesday, November 25, 2008
A Step In The Right Direction
THE BE YOUR OWN ECONOMIST ® BLOG
The Lehmann Letter ©
Today the Fed announced two initiatives designed to hasten our emergence from the financial crisis (http://www.federalreserve.gov/newsevents/press/monetary/20081125a.htm and http://www.federalreserve.gov/newsevents/press/monetary/20081125b.htm.)
In the Fed’s own words:
“…the Term Asset-Backed Securities Loan Facility (TALF), (is) a facility that will help market participants meet the credit needs of households and small businesses by supporting the issuance of asset-backed securities (ABS) collateralized by student loans, auto loans, credit card loans, and loans guaranteed by the Small Business Administration (SBA).
“Under the TALF, the Federal Reserve Bank of New York (FRBNY) will lend up to $200 billion on a non-recourse basis to holders of certain AAA-rated ABS backed by newly and recently originated consumer and small business loans. The FRBNY will lend an amount equal to the market value of the ABS less a haircut and will be secured at all times by the ABS. The U.S. Treasury Department--under the Troubled Assets Relief Program (TARP) of the Emergency Economic Stabilization Act of 2008--will provide $20 billion of credit protection to the FRBNY in connection with the TALF….”
“New issuance of ABS declined precipitously in September and came to a halt in October. At the same time, interest rate spreads on AAA-rated tranches of ABS soared to levels well outside the range of historical experience, reflecting unusually high risk premiums. The ABS markets historically have funded a substantial share of consumer credit and SBA-guaranteed small business loans. Continued disruption of these markets could significantly limit the availability of credit to households and small businesses and thereby contribute to further weakening of U.S. economic activity. The TALF is designed to increase credit availability and support economic activity by facilitating renewed issuance of consumer and small business ABS at more normal interest rate spreads.”
In addition:
“The Federal Reserve … will initiate a program to purchase the direct obligations of housing-related government-sponsored enterprises (GSEs)--Fannie Mae, Freddie Mac, and the Federal Home Loan Banks--and mortgage-backed securities (MBS) backed by Fannie Mae, Freddie Mac, and Ginnie Mae. Spreads of rates on GSE debt and on GSE-guaranteed mortgages have widened appreciably of late. This action is being taken to reduce the cost and increase the availability of credit for the purchase of houses, which in turn should support housing markets and foster improved conditions in financial markets more generally…..”
The Fed, with the Treasury’s assistance, wants to boost household purchases of durable goods (by freeing consumer credit) and new homes (by freeing mortgage borrowing). These measures should help.
But note the dire conditions in the asset-backed and mortgage-backed securities markets as revealed by the following excerpts from the Fed’s press release:
“New issuance of ABS declined precipitously in September and came to a halt in October. At the same time, interest rate spreads on AAA-rated tranches of ABS soared to levels well outside the range of historical experience, reflecting unusually high risk premiums. ……….Spreads of rates on GSE debt and on GSE-guaranteed mortgages have widened appreciably of late.“
Will the Fed’s actions be sufficient? To what extent are households reducing their purchases of durable goods and homes because they can’t obtain credit and to what extent are households reducing their purchases because they want to protect their balance sheets? And what role does the ongoing collapse of home prices contribute to the crisis and households’ desire to protect their balance sheets?
Perhaps a general moratorium on home foreclosures and massive assistance to indebted homeowners, by attacking the root cause of the crisis (collapsing home values), is the requisite first step that must be taken before other measures can become fully effective.
© 2008 Michael B. Lehmann
Monday, November 24, 2008
The New President’s Dilemma
THE BE YOUR OWN ECONOMIST ® BLOG
The Lehmann Letter ©
The Following Op-Ed ran in The San Francisco Chronicle on November 12 (http://www.sfgate.com/cgi-bin/article.cgi?f=/c/a/2008/11/12/EDLJ142NQS.DTL&hw=Michael+Lehmann&sn=001&sc=1000) . It’s still true.
President-elect Barack Obama faces a dilemma.
A severe recession is unfolding. Demand, production, employment, income - all are falling and falling hard. The new president has two traditional remedies at his disposal: Reduce taxes so that consumers can purchase more, thereby stimulating production and employment, or increase public-works spending to directly boost employment. These remedies will, of course, raise the federal deficit.
Therein lies the dilemma: The president cannot effectively deal with the recession and shrink the deficit. Which horn of the dilemma should the president choose?
In the spring of 1933, the same dilemma confronted President Franklin D. Roosevelt. FDR had campaigned on a balanced-budget platform. But when he took office, events left him no choice. FDR'S administration enacted sweeping measures that lifted federal spending and the federal deficit. The Works Progress Administration and the Civilian Conservation Corps spent billions on public works and employed millions. The deficit grew.
Obama now confronts the most serious economic crisis and dilemma since the Great Depression. Like FDR, he must choose between promoting economic recovery and containing the deficit. He can't do both.
The new president can use the $700 billion bank bailout as a template. In that instance, Congress moved decisively to meet the financial crisis. President Obama should present Congress with an equally large, bold and urgent program of tax cuts and spending increases to deal immediately with the recession. Households living from hand to mouth will spend any increase in after-tax income or extension of unemployment benefits. Now is the time to invest in the nation's crumbling infrastructure and the energy-independence and green-technology programs that Obama advocated.
The deficit will grow dramatically and the new administration should deal with it as soon as economic recovery is assured. Meanwhile, interest rates have fallen and the dollar has strengthened, proving that foreign investors remain willing to invest in America. If the rest of the world wants to invest in America, why shouldn't we? Recession confronts us immediately; national bankruptcy does not.
Now is not the time to think small.
© 2008 Michael B. Lehmann
Tuesday, November 11, 2008
Taking A Break
THE BE YOUR OWN ECONOMIST ® BLOG
The Lehmann Letter ©
The blogger will take a brief respite and return on or about November 19.
© 2008 Michael B. Lehmann
The Lehmann Letter ©
The blogger will take a brief respite and return on or about November 19.
© 2008 Michael B. Lehmann
What About Homeowners?
THE BE YOUR OWN ECONOMIST ® BLOG
The Lehmann Letter ©
Every day we learn the government bailout has been extended to more businesses or there’s an effort under way to broaden the bailout’s coverage.
The banks are gobbling up their share of the $700 billion package. AIG’s assistance has topped $100 billion. The automakers will probably receive a rescue package. American Express has obtained permission to become a bank in order to ease the strains facing its credit-card business.
Meanwhile, home prices continue to plunge as foreclosures grow. Millions will lose their homes and millions more will end up under water (mortgage debt exceeds home’s value). What’s fair about that? Why should homeowners suffer while financial institutions and manufacturers are thrown a life line?
Everyone knows what needs to be done. There should be an immediate 90-day moratorium on foreclosures. During that period mortgages should be written down to the property’s market value for those homeowners who can’t make their payments. This entails a means test, so one should be created. If the homeowner still can’t pay the mortgage, then the term of the loan should be extended and the interest rate reduced. The federal government can compensate the lender for any loss.
That would direct relief to those who need it most.
Would there be complaints by those not facing foreclosure because the means test demonstrated their ability to pay? Would they be jealous of those who received assistance when they did not? Perhaps. But it would still be worth it to stop the losses and halt the foreclosures.
Would prices stop falling? Probably not. But they would not fall as far as they will fall if we don’t stop the foreclosures.
Washington should stop thinking small!
© 2008 Michael B. Lehmann
Friday, November 7, 2008
Minus 1.2 Million, And Counting
THE BE YOUR OWN ECONOMIST ® BLOG
The Lehmann Letter ©
This morning’s employment report was remarkable (http://stats.bls.gov/news.release/empsit.nr0.htm). It began:
“Nonfarm payroll employment fell by 240,000 in October, and the unemployment rate rose from 6.1 to 6.5 percent, the Bureau of Labor Statistics of the U.S. Department of Labor reported today. October's drop in payroll employment followed declines of 127,000 in August and 284,000 in September, as revised. Employment has fallen by 1.2 million in the first 10 months of 2008; over half of the decrease has occurred in the past 3 months. In October, job losses continued in manufacturing, construction, and several service-providing industries. Health care and mining continued to add jobs.”
We lost 240,000 jobs last month and September’s loss was revised upward to 284,000. Moreover, we’ve lost 1.2 million jobs this year, for an average monthly loss of 120,000. That’s awful.
If you update the chart below in your mind’s eye, you can see that the recent monthly losses of 284,000 and 240,000 are as bad as the 2001 dot-com recession. And all signs seem to say: The worst is yet to come.
Job Growth
(Click on chart to enlarge)

© 2008 Michael B. Lehmann
The Lehmann Letter ©
This morning’s employment report was remarkable (http://stats.bls.gov/news.release/empsit.nr0.htm). It began:
“Nonfarm payroll employment fell by 240,000 in October, and the unemployment rate rose from 6.1 to 6.5 percent, the Bureau of Labor Statistics of the U.S. Department of Labor reported today. October's drop in payroll employment followed declines of 127,000 in August and 284,000 in September, as revised. Employment has fallen by 1.2 million in the first 10 months of 2008; over half of the decrease has occurred in the past 3 months. In October, job losses continued in manufacturing, construction, and several service-providing industries. Health care and mining continued to add jobs.”
We lost 240,000 jobs last month and September’s loss was revised upward to 284,000. Moreover, we’ve lost 1.2 million jobs this year, for an average monthly loss of 120,000. That’s awful.
If you update the chart below in your mind’s eye, you can see that the recent monthly losses of 284,000 and 240,000 are as bad as the 2001 dot-com recession. And all signs seem to say: The worst is yet to come.
Job Growth
(Click on chart to enlarge)

Recessions shaded
The chart was taken from http://www.beyourowneconomist.com. [Click on Seminars and then Charts.] Go there for additional charts on the economy and a list of economic indicators.)
The chart was taken from http://www.beyourowneconomist.com. [Click on Seminars and then Charts.] Go there for additional charts on the economy and a list of economic indicators.)
© 2008 Michael B. Lehmann
Wednesday, November 5, 2008
The New President’s Dilemma
THE BE YOUR OWN ECONOMIST ® BLOG
The Lehmann Letter ©
President-elect Barack Obama faces a dilemma.
A severe recession is unfolding. Demand, production, employment, income – all are falling and falling hard. The new president has two traditional remedies at his disposal: Reduce taxes so that consumers can purchase more, thereby stimulating production and employment, or increase public-works spending to directly boost employment. These remedies will, of course, raise the federal deficit.
Therein lies the dilemma: The president can not effectively deal with the recession and shrink the deficit. Which horn of the dilemma should the president choose? Fight the recession or deal with the deficit?
In the spring of 1933 the same dilemma confronted President Roosevelt. FDR had campaigned on a balanced-budget platform. But when he took office, current events left him no choice. FDR’S administration enacted sweeping measures that lifted federal spending and the federal deficit. The Works Progress Administration and the Civilian Conservation Corps spent billions on public works and employed millions. The deficit grew.
Barack Obama now confronts the most serious economic crisis and dilemma since the Great Depression. Like FDR he must choose between promoting economic recovery and containing the deficit. He can’t do both.
The new president can use the $700 billion bank bailout as a template. In that instance Congress moved decisively to meet the financial crisis. President Obama should present Congress with an equally large, bold and urgent program of tax cuts and spending increases to deal immediately with the recession. Households living from hand to mouth will spend any increase in after-tax income or extension of unemployment benefits. Now is the time to invest in the nation’s crumbling infrastructure and the energy-independence and green-technology programs that Mr. Obama advocated.
The deficit will grow dramatically and the new administration should deal with it as soon as economic recovery is assured. Meanwhile, interest rates have fallen and the dollar has strengthened, proving that foreign investors remain willing to purchase Treasury securities. Recession confronts us immediately; national bankruptcy does not.
Now is not the time to think small.
© 2008 Michael B. Lehmann
Tuesday, November 4, 2008
10.5
THE BE YOUR OWN ECONOMIST ® BLOG
The Lehmann Letter ©
Everette P. Johnson at the Bureau of Economic Analysis has done a great job over the years maintaining the Bureau’s motor-vehicle-sales data base. The number for the previous month usually appears about the third or fourth of the current month. So there’s little delay.
Here’s how to obtain the data.
Step 1: Go to http://www.bea.gov/
Step 1: Click on "Gross Domestic Product" under "National"
Step 2: Scroll down and click on "Motor Vehicles" under "Supplemental Estimates"
Step 3: Save to your desktop as an Excel file and then open the file
Step 4: Click on the "Table 6" tab at the bottom of the page
Step 5: Look at column I (Light Total) and scroll down for the latest data
You can see that 10.5 million vehicles sold in October 2008 at a seasonally-adjusted annual rate.
Put that figure in perspective by reviewing the data over the past year.
2007
October .............16.0
November..........16.0
December...........16.0
2008
January..............15.3
February............15.3
March.................15.0
April...................14.5
May....................14.2
June...................13.6
July....................12.5
August................13.7
September..........12.5
October..............10.5
Sales were falling before the financial crisis. Then they began to collapse.
Now examine the chart for historical perspective, updating it in your mind’s eye with the 10.5 October total.
New-Vehicle Sales
(Click on chart to enlarge)
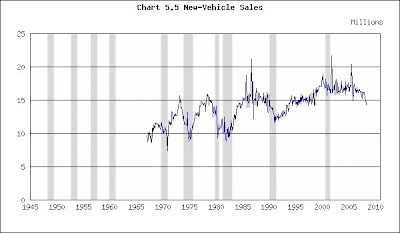
© 2008 Michael B. Lehmann
The Lehmann Letter ©
Everette P. Johnson at the Bureau of Economic Analysis has done a great job over the years maintaining the Bureau’s motor-vehicle-sales data base. The number for the previous month usually appears about the third or fourth of the current month. So there’s little delay.
Here’s how to obtain the data.
Step 1: Go to http://www.bea.gov/
Step 1: Click on "Gross Domestic Product" under "National"
Step 2: Scroll down and click on "Motor Vehicles" under "Supplemental Estimates"
Step 3: Save to your desktop as an Excel file and then open the file
Step 4: Click on the "Table 6" tab at the bottom of the page
Step 5: Look at column I (Light Total) and scroll down for the latest data
You can see that 10.5 million vehicles sold in October 2008 at a seasonally-adjusted annual rate.
Put that figure in perspective by reviewing the data over the past year.
2007
October .............16.0
November..........16.0
December...........16.0
2008
January..............15.3
February............15.3
March.................15.0
April...................14.5
May....................14.2
June...................13.6
July....................12.5
August................13.7
September..........12.5
October..............10.5
Sales were falling before the financial crisis. Then they began to collapse.
Now examine the chart for historical perspective, updating it in your mind’s eye with the 10.5 October total.
New-Vehicle Sales
(Click on chart to enlarge)

Recessions shaded
You can see that auto sales did not suffer in the 2001 recession. Falling interest rates kept them afloat, just as they buoyed residential real estate.
Nor did auto sales fall below 12 million in the 1990-91 recession.
We have to go back to1981-82 and earlier recessions for numbers that fleetingly dip below 10 million.
The most recent data and the swiftness of its plunge portend real disaster for the industry. Will sales drop below 10 million? If so, how far? What can save the industry? Falling fuel prices? Falling interest rates? Smaller vehicles? Maybe, maybe and maybe.
Then we’re reminded of consumer confidence’s October reading – 38 – and that further dampens hope (http://beyourowneconomist.blogspot.com/2008/10/blue-christmas.html) because consumer confidence is at a post-WWII low. Why should consumers buy when they feel so miserable?
Now think of all those industries dependant upon motor-vehicle sales: steel, glass, rubber tires, fuzzy dice.
It’s not good.
(The chart was taken from http://www.beyourowneconomist.com. [Click on Seminars and then Charts.] Go there for additional charts on the economy and a list of economic indicators.)
© 2008 Michael B. Lehmann
Monday, November 3, 2008
Another Bad Number
THE BE YOUR OWN ECONOMIST ® BLOG
The Lehmann Letter ©
Today the Institute for Supply Management reported its October Purchasing Managers’ Index at 38.9 (http://www.ism.ws/ISMReport/MfgROB.cfm?navItemNumber=12942).
Norbert J. Ore, the Institute’s chair, said: "The PMI indicates a significantly faster rate of decline in manufacturing when comparing October to September. It appears that manufacturing is experiencing significant demand destruction as a result of recent events, with members indicating challenges associated with the financial crisis, interruptions from the Gulf hurricane, and the lagging impact from higher oil prices. This is the lowest level for the PMI since September 1982 when it registered 38.8 percent. In this report, we see inflationary pressures dissolving as the Prices Index fell to 37 percent, the lowest since December 2001 when it registered 33.2 percent. Export orders also contracted for the first time following 70 months of growth."
Pay attention: ‘….. significantly faster rate of decline...,” “ significant demand destruction…,” “…”inflationary pressures dissolving…,” “…Export orders also contracted for the first time following 70 months of growth."
And then look again at that number – 38.9 – and use it to update the chart.
Purchasing Managers’ Index
(Click on chart to enlarge)

Recessions shaded
We’re down to levels not seen since the 1981-82 recession. That’s bad.
But it will get worse. Manufacturing has only just begun its hard contraction. So far it’s been slipping. Now the sliding starts. As purchases of consumer durables (think autos) and nondurables (such as apparel) plunge in the fourth quarter, manufacturing activity will shrink.
How do we know? Check out the October 28 blog, Blue Christmas, at http://beyourowneconomist.blogspot.com/2008/10/blue-christmas.html.
Consumer confidence has fallen to its lowest recorded post-WWII level. Consumers won’t spend under those conditions, and manufacturers’ markets will consequently dry up.
And why should businesses invest in new capacity under these circumstances? That’s another weak spot for manufacturing.
Then scroll back up to see what Mr. Ore said about exports: “…Export orders also contracted for the first time following 70 months of growth." The rest of the world can’t buy our goods when their economies are shrinking and the dollar is stronger.
Finally, what about Mr. Ore’s comment that “…”inflationary pressures (are) dissolving….” Isn’t that a silver lining? Sorry, that’s just further confirmation that demand is weak.
The bottom line: Things are bad and getting worse.
(The chart was taken from http://www.beyourowneconomist.com. [Click on Seminars and then Charts.] Go there for additional charts on the economy and a list of economic indicators.)
© 2008 Michael B. Lehmann
November Publication Schedule & Web Sources
THE BE YOUR OWN ECONOMIST ® BLOG
The Lehmann Letter ©
You can use the WEB SOURCES listing (below) to find the data on your own and read the accompanying press release. The addresses take you to the source’s home page and the steps tell you how to navigate the site. That way (rather than provide a direct link to the data) you can become familiar with these sites and find additional information on your own.
PUBLICATION SCHEDULE
November 2008
Source (* below)…………Series Description…………Day & Date
Quarterly Data
BLS………………….Productivity………………………….Thu, 6th
BEA…………………………GDP……………………...……Tue, 25th
Monthly Data
ISM………………….Purchasing managers’ index……….Mon, 3rd
Fed…………………………..Consumer credit……..……….Fri, 7th
BLS………………………….Employment………………… Fri, 7th
Census……………………...Balance of trade………………Thu, 13th
Census……………………...Retail trade…………………….Fri, 14th
Census……………………...Inventories……………………..Fri, 14th
Fed…………………………..Industrial production………….Mon, 17th
Fed………………………….Capacity utilization…………….Mon, 17th
BLS………………………….Producer prices……………….Tue, 18th
BLS………………………….Consumer prices……………...Wed, 19th
Census……………………..Housing starts………………….Wed, 19th
Conf Bd…………………….Leading Indicators…………….Thu, 20th
NAR…………………………Existing-home sales…….…….Mon, 24th
Conf Bd…………………….Consumer confidence…………Tue, 25th
Census…………………….Capital goods……………….…..Wed, 26th
Census……………………..New-home sales……………….Wed, 26th
* BEA = Bureau of Economic Analysis of the U.S. Department of Commerce
* BLS = Bureau of Labor Statistics of the U.S. Department of Labor
* Census = U.S. Bureau of the Census
* Conf Bd = Conference Board
* Fed = Federal Reserve System
* ISM = Institute for Supply Management
* NAR = National Association of Realtors
WEB SOURCES
Index of Leading Economic Indicators: http://www.conference-board.org/..........
Step 1: Click on "Economics" in the left-hand menu bar…………………………………….
Step 2: Click on "Economic Indicators" under "Economics" in the left-hand menu bar………………………………………………………………………………………………………………..
Step 3: Click on link under "U.S. Leading Indicators"………………………………………
Gross Domestic Product: http://www.bea.gov/....................................................
Step 1: Click on "Gross Domestic Product" under "National"………………………….
Step 2: Click on "National Income and Product Accounts Tables" under "Gross Domestic Product (GDP)"……………………………………………………………………………
Step 3: Click on "list of all NIPA Tables"………………………………………………………….
Step 4: Click on "Table 1.1.6. Real Gross Domestic Product..." and "Table 1.1.1. Percent Change
Step 5: Scroll down to line 1 in both tables and go to the last column on the right
Industrial Production & Capacity Utilization: http://www.federalreserve.gov/
Step 1: Click on "All Statistical Releases" under "Recent Statistical Releases" and then click on "Industrial Production and Capacity Utilization" under "Principal Economic Indicators" in the upper left…………………………………………………………
Step 2: Find the latest monthly data in the table next to "Total index" and "Total industry"……………………………………………………………………………………………………..
Institute For Supply Management Index: http://www.ism.ws/ ……………………….
Step 1: Click on "ISM Report on Business" in left-hand menu bar……………………
Step 2: Click on “Latest Manufacturing ROB” and find the latest PMI…………….
Producer Prices: http://stats.bls.gov/.....................................................................
Step 1: Click on “Producer Price Indexes” under “Inflation & Consumer Spending” in left-hand menu bar………………………………………………………………….
Step 2: Note "Finished goods" under "Latest Numbers" in upper right and multiply by 12 to put the data on an annual basis……………………………………….
Business Capital Expenditures (Nondefense Capital Goods): http://www.census.gov/
Step 1: Click on "Economic Indicators" in the lower right…………………………………
Step 2: Click on "PDF" on the left under "Advance Report on Durable Goods Manufacturers' Shipments and Orders"…………………………………………………………..
Step 3: Scroll down to Table 1 and find new orders for nondefense capital goods near the bottom……………………………………………………………………………………………..
Inventories, Sales & Inventory/Sales Ratio: http://www.census.gov/
Step 1: Click on "Economic Indicators" in the lower right…………………………………
Step 2: Click on "HTML" on the left under "Manufacturing and Trade Inventories and Sales" Step 3: Scroll down to Table 1 and subtract previous month's inventories from latest month's and multiply by 12 to obtain inventory change, and then obtain the most recent inventory/sales ratio……………………………………………………………………
Consumer Price Index: http://stats.bls.gov/...........................................................
Step 1: Click on “Consumer Price Index” under “Inflation & Consumer Spending” in left-hand menu bar………………………………………………………………………………….
Step 2: Note "CPI-U..." at the top under "Latest Numbers" in upper right and multiply "SA" by 12 to put the data on an annual basis…………………………………..
Employment Data (Total Non-farm Payroll Employment) (Unemployment Rate) (Manufacturing Workweek): http://stats.bls.gov/ ………………………………………..
Step 1: Click on “National Employment” under “Employment & Unemployment” in right-hand menu bar………………………………………………………………………………
Step 2: Click on (HTML) following “Employment Situation Summary” under "Economic News Releases"……………………………………………………………………….
Step 3: Click on “Employment Situation Summary” under “Table of Contents”
Step 4: Scroll down to Table A and find the unemployment rate for all workers in the latest month, the change in nonfarm employment in the last column and manufacturing hours of work for the latest month…………………………………………..
Personal Income: http://www.bea.gov/.....................................................................
Step 1: Click on "Gross Domestic Product" under "National"……………………………..
Step 2: Click on "National Income and Product Accounts Tables" under "Gross Domestic Product (GDP)"…………………………………………………………………………….
Step 3: Click on "list of all NIPA Tables"……………………………………………………….
Step 4: Click on "Table 2.6 Personal Income...."
Step 5: Scroll down to line 1…………………………………………………………………………..
Consumer Confidence: http://www.conference-board.org/....................................
Step 1: Click on the "Economics" in the left-hand menu bar……………………………….
Step 2: Click on "Economic Indicators" under "Economics" in the left-hand menu bar………………………………………………………………………………………………………………..
Step 3: Click on link under "Consumer Confidence Index"…………………………………
Consumer Credit: http://www.federalreserve.gov/...................................................
Step 1: Click on "All Statistical Releases" under "Recent Statistical Releases" and then click on "Consumer credit -- G19" under "Household Finance" in the upper right…………………………………………………………………………………………………………..
Step 2: Click on "Current Release"…………………………………………………………………
Step 3: Go to "Amount ... billions of dollars" and subtract previous month from current month & multiply by 12 to obtain seasonally adjusted dollar amount at annual rate………………………………………………………………………………………………..
Housing Starts: http://www.census.gov/..................................................................
Step 1: Click on "Economic Indicators" in the lower right………………………………….
Step 2: Click on "PDF" on the left under "Current Press Release" under "Housing Starts/Building Permits"………………………………………………………………………………..
Step 3: Scroll down to "Housing Starts"…………………………………………………………..
Home Sales (Existing-Home Sales): http://www.realtor.org/.................................
Step 1: Click on "Research" in the left-hand menu bar……………………………………….
Step 2: Find "Existing-Home Sales" under "Housing Indicators"……………………..
Home Sales (New-Home Sales): http://www.census.gov/.......................................
Step 1: Click on "Economic Indicators" in the lower right………………………………..
Step 2: Click on "PDF" on the left under "Current Press Release" under "New Home Sales"………………………………………………………………………………………………….
Retail Sales: http://www.census.gov/.......................................................................
Step 1: Click on "Economic Indicators" in the lower right…………………………………..
Step 2: Scroll down to "Advance Monthly Sales for Retail and Food Services" and click on "HTML" on the left under "Current Press Release"………………………………
© 2008 Michael B. Lehmann
Thursday, October 30, 2008
It Will Be Ugly
THE BE YOUR OWN ECONOMIST ® BLOG
Here are the key paragraphs from today’s GDP release for the third quarter
(http://www.bea.gov/newsreleases/national/gdp/2008/txt/gdp308a.txt):
“Real gross domestic product -- the output of goods and services produced by labor and property located in the United States -- decreased at an annual rate of 0.3 percent in the third quarter of 2008, (that is, from the second quarter to the third quarter), according to advance estimates released by theBureau of Economic Analysis. In the second quarter, real GDP increased 2.8 percent……
“The decrease in real GDP in the third quarter primarily reflected negative contributions from personal consumption expenditures (PCE), residential fixed investment, and equipment and software that were largely offset by positive contributions from federal government spending, exports, private inventory investment, nonresidential structures, and state and local government spending. Imports, which are a subtraction in the calculation of GDP, decreased.
“Most of the major components contributed to the downturn in real GDP growth in the third quarter. The largest contributors were a sharp downturn in PCE for nondurable goods, a smaller decrease in imports, a larger decrease in PCE for durable goods, and a deceleration in exports. Notable offsets were an upturn in inventory investment and an acceleration in federal government spending.”
If you look at the tables accompanying the report you’ll see that personal consumption expenditures fell by 3.1% due to a 16.1% decline in durable-goods purchases and a 6.4% drop in nondurable-goods expenditures. Spending on services continued to grow.
This is cause for alarm because this report covers July, August and September, i.e. before the financial crisis hit. There’s every indication that consumer outlays have fallen into the deep freeze with the crisis’s advent. How low will these numbers plunge for the October, November and December quarter? Most likely response: It will be ugly.
© 2008 Michael B. Lehmann
Wednesday, October 29, 2008
Pushing On A String
THE BE YOUR OWN ECONOMIST ® BLOG
Today the Federal Reserve reduced the federal funds rate – the rate at which banks lend reserves to one another – by half-a-percent to one percent.
The following paragraph is an excerpt from the Fed’s statement (http://www.federalreserve.gov/newsevents/press/monetary/20081029a.htm):
“The pace of economic activity appears to have slowed markedly, owing importantly to a decline in consumer expenditures. Business equipment spending and industrial production have weakened in recent months, and slowing economic activity in many foreign economies is damping the prospects for U.S. exports. Moreover, the intensification of financial market turmoil is likely to exert additional restraint on spending, partly by further reducing the ability of households and businesses to obtain credit. “
In other words, we’re in for a bad recession.
Will the Fed’s rate cut pull us out of the ditch?
Unfortunately today is not 2001. Back then, as the dot-com recession unfolded, the Fed reduced interest rates in order to stimulate borrowing and spending, and thereby revive the economy. Real estate responded by generating the housing bubble whose collapse is responsible for the current debacle. It does not seem likely that reducing rates today will instigate another building boom. Home prices keep falling as the market attempts to absorb the leftovers from the earlier glut. Until that process winds down, lower rates can not help much.
This problem is replicated throughout the economy. Motor-vehicle sales are heading south because households wish to repay debt and preserve liquidity. For many this is not the right time to buy a car no matter how low rates have fallen. Businesses seem to be cutting back for the same reason. Few see today as the right time to invest in additional facilities and employees. Quite to the contrary, employment is falling as layoffs rise.
Economists once said that interest rates are like a string – far better at holding the economy back than pushing it forward. That proved to be incorrect in 2001. It may be correct today.
© 2008 Michael B. Lehmann
Tuesday, October 28, 2008
Blue Christmas
THE BE YOUR OWN ECONOMIST ® BLOG
Today the Conference Board released its consumer-confidence survey
(http://www.conference-board.org/economics/ConsumerConfidence.cfm ).
The following paragraphs are from the accompanying press release:
“The Conference Board Consumer Confidence Index™, which had improved moderately in September, fell to an all-time low in October. The Index now stands at 38.0 (1985=100), down from 61.4 in September….
"Says Lynn Franco, Director of The Conference Board Consumer Research Center: "The impact of the financial crisis over the last several weeks has clearly taken a toll on consumers' confidence. The decline in the Index (-23.4 points) is the third largest in the history of the series, and the lowest reading on record. In assessing current conditions, consumers rated the labor market and business conditions much less favorably, suggesting that the fourth quarter is off to a weaker start than the third quarter. Looking ahead, consumers are extremely pessimistic, and a significantly larger proportion than last month foresees business and labor market conditions worsening. Their earnings outlook, as well as inflation outlook, is also more pessimistic, and this news does not bode well for retailers who are already bracing for what is shaping up to be a very challenging holiday season."
There are a number of remarkable features of this release, including the single-month drop of over 20 points. Perhaps the most dramatic of all is the perspective gained when you update the chart below with the latest reading of 38.0
Consumer Confidence
(Click on chart to enlarge)

© 2008 Michael B. Lehmann
Today the Conference Board released its consumer-confidence survey
(http://www.conference-board.org/economics/ConsumerConfidence.cfm ).
The following paragraphs are from the accompanying press release:
“The Conference Board Consumer Confidence Index™, which had improved moderately in September, fell to an all-time low in October. The Index now stands at 38.0 (1985=100), down from 61.4 in September….
"Says Lynn Franco, Director of The Conference Board Consumer Research Center: "The impact of the financial crisis over the last several weeks has clearly taken a toll on consumers' confidence. The decline in the Index (-23.4 points) is the third largest in the history of the series, and the lowest reading on record. In assessing current conditions, consumers rated the labor market and business conditions much less favorably, suggesting that the fourth quarter is off to a weaker start than the third quarter. Looking ahead, consumers are extremely pessimistic, and a significantly larger proportion than last month foresees business and labor market conditions worsening. Their earnings outlook, as well as inflation outlook, is also more pessimistic, and this news does not bode well for retailers who are already bracing for what is shaping up to be a very challenging holiday season."
There are a number of remarkable features of this release, including the single-month drop of over 20 points. Perhaps the most dramatic of all is the perspective gained when you update the chart below with the latest reading of 38.0
Consumer Confidence
(Click on chart to enlarge)

Recessions shaded
You can see that the index has never before fallen below 40, and you can see that recession has accompanied all past readings of 60 or lower. Observers quibble over whether or not month-to-month changes in consumer confidence forecast household expenditures. But there seems no arguing about the historical significance of this indicator. The correlation between its downward trends and recession seems quite clear.
Nonetheless we must wonder…… What is the significance of 38.0, the lowest reading ever? How much lower will the index fall? What is the significance for consumer purchases of everything from travel to autos? How severe will be the unfolding recession?
One thing for sure. It looks like a Blue Christmas for retailers and many more as well.
(The chart was taken from http://www.beyourowneconomist.com. [Click on Seminars and then Charts.] Go there for additional charts on the economy and a list of economic indicators.)
© 2008 Michael B. Lehmann
Monday, October 27, 2008
Ray of Hope?
THE BE YOUR OWN ECONOMIST ® BLOG
Today the Census Bureau said (http://www.census.gov/const/newressales.pdf):
“Sales of new one-family houses in September 2008 were at a seasonally adjusted annual rate of 464,000, according to estimates released jointly today by the U.S. Census Bureau and the Department of Housing and Urban Development. This is 2.7 percent (±12.1%)* above the revised August rate of 452,000, but is 33.1 percent (±8.9%) below the September 2007 estimate of 694,000.
“The median sales price of new houses sold in September 2008 was $218,400; the average sales price was $275,500. The seasonally adjusted estimate of new houses for sale at the end of September was 394,000. This represents a supply of 10.4 months at the current sales rate.”
Bottom Line: Prices continued to fall and inventories remained near record highs.
This reinforced the impression created by the National Association of Realtors” October 24 report (http://www.realtor.org/press_room/news_releases/2008/ehs_rise_on_affordability?LID=RONav0021 ):
"Existing-home sales increased last month as buyers responded to improved housing affordability conditions, according to the National Association of Realtors®.
"Existing-home sales – including single-family, townhomes, condominiums and co-ops – rose 5.5 percent to a seasonally adjusted annual rate¹ of 5.18 million units in September from a level of 4.91 million in August, and are 1.4 percent higher than the 5.11 million-unit pace in September 2007.
"The national median existing-home price3 for all housing types was $191,600 in September, down 9.0 percent from a year ago when the median was $210,500. "
Bottom Line: Prices continued to fall and inventories remained near record highs.
Conclusion: The pace of sales for new and existing homes may be bottoming out, but price-discounting leads the way and inventories remain high. This is bad news for homeowners whose equity continues to melt away as prices decline. It’s hard to see how economic conditions can stabilize without home-price stability. As long as household wealth continues to decline, households will limit their spending.
© 2008 Michael B. Lehmann
Thursday, October 23, 2008
The Maestro Testifies
THE BE YOUR OWN ECONOMIST ® BLOG
Alan Greenspan testified today before the House Committee on Oversight and Government Reform. Here are some excerpts from his prepared remarks (http://oversight.house.gov/documents/20081023100438.pdf).
“In 2005, I raised concerns that the protracted period of underpricing of risk, if history was any guide, would have dire consequences. This crisis, however, has turned out to be much broader than anything I could have imagined. It has morphed from one gripped by liquidity restraints to one in which fears of insolvency are now paramount………
“What went wrong with global economic policies that had worked so effectively for nearly four decades? The breakdown has been most apparent in the securitization of home mortgages. The evidence strongly suggests that without the excess demand from securitizers, subprime mortgage originations (undeniably the original source of crisis) would have been far smaller and defaults accordingly far fewer………….
“It was the failure to properly price such risky assets that precipitated the crisis. In recent decades, a vast risk management and pricing system has evolved, combining the best insights of mathematicians and finance experts supported by major advances in computer and communications technology……….
“When in August 2007 markets eventually trashed the credit agencies’ rosy ratings, a blanket of uncertainty descended on the investment community. Doubt was indiscriminately cast on the pricing of securities that had any taint of subprime backing. As much as I would prefer it otherwise, in this financial environment I see no choice but to require that all securitizers retain a meaningful part of the securities they issue. This will offset in part market deficiencies stemming from the failures of counterparty surveillance.
“There are additional regulatory changes that this breakdown of the central pillar of competitive markets requires in order to return to stability, particularly in the areas of fraud, settlement, and securitization. It is important to remember, however, that whatever regulatory changes are made, they will pale in comparison to the change already evident in today’s markets. Those markets for an indefinite future will be far more restrained than would any currently contemplated new regulatory regime……….
“This crisis will pass, and America will reemerge with a far sounder financial system.”
These quotations summarize The Maestro’s views on the causes of the crisis and its consequences for mortgage markets as well as his belief that “…America will reemerge with a far sounder financial system.”
Four questions:
1. What about The Maestro’s role in pumping up the real-estate bubble? The Fed drove interest rates into the basement in 2001 and held them there despite a robust housing market. This was the root cause of the 100-year flood of real-estate speculation in 2002 through 2006. No root cause, no bubble.
2. What about The Maestro’s rejection of pleas by federal regulators that the Fed support enhanced regulation, supervision and oversight of mortgage markets in the face of the unfolding sub-prime abuses? Adequate regulation, supervision and oversight of mortgage markets could have restrained the bubble.
3. Didn’t The Maestro say that goods-and-services price inflation is the Fed’s concern, but asset inflation is not? If the Fed had registered sufficient concern, perhaps the real-estate bubble could have been restrained.
4. Didn’t The Maestro say that real-estate bubble’s can’t occur because people live in their homes – unlike stocks - and home prices always rise? So much for those points of view.
There may be additional issues, but these are a good start.
© 2008 Michael B. Lehmann
Tuesday, October 14, 2008
Out of Action
THE BE YOUR OWN ECONOMIST ® BLOG
The blogger will attend his 50th high school reunion this weekend and be out of action for a week.
© 2008 Michael B. Lehmann
The blogger will attend his 50th high school reunion this weekend and be out of action for a week.
© 2008 Michael B. Lehmann
Have We Learned Our Lesson?
THE BE YOUR OWN ECONOMIST ® BLOG
The following reworks yesterday’s posting:
The federal government’s new plan to invest in the nation’s banks, guarantee their loans and insure their deposits is welcome news. It borrows from European initiatives launched over the weekend and improves upon our own bailout package.
But many people will ask, “What took us so long? We led the world into crisis, why couldn’t we lead the world out of crisis?”
Most economists said Federal Reserve Chairman Ben Bernanke’s research on the Great Depression of the 1930s well-prepared him for the job. They believed that Mr. Bernanke’s scholarship would help him avoid the kind of crisis that recently befell us.
Mr. Bernanke endorsed the conventional wisdom that the Fed’s high-interest-rate policies in the 1930s turned a run-of-the-mill recession into the Great Depression. Instead, the argument goes, the Fed should have reduced interest rates to stimulate borrowing and spending.
The view that misguided government policy caused the Great Depression soon became part and parcel of the notion that government can’t do anything right. Few stopped to ask: “Just because a policy failed, why does that condemn all government action?”
Recently, under Chairman Bernanke, laissez faire principles motivated the Fed to maintain a hands-off, minimalist approach. The Fed let low interest rates and lax lending standards inflate the real-estate bubble. When the bubble began to deflate and mortgage-backed securities instigated the global financial crisis, the Fed and the Treasury underplayed the problem. Instead of taking a systematic and systemic approach they proceeded in an ad hoc and piecemeal fashion. Eventually credit markets became so impaired and the emergency so pronounced, the Fed and the Treasury felt compelled to reverse course and implement a comprehensive government rescue of the financial system.
What an irony. Economists endorsed Mr. Bernanke because they believed he had learned from mistakes the Fed made during the Great Depression. But those lessons were clearly insufficient to avert the recent crisis. The real lesson is that blind adherence to free-market principles, not government action, was the chief culprit this time. On occasion a wise, well-informed and intelligent pragmatism is what’s really needed.
© 2008 Michael B. Lehmann
Monday, October 13, 2008
Words and Deeds
THE BE YOUR OWN ECONOMIST ® BLOG
When President Bush appointed Ben Bernanke Chairman of the Federal Reserve’s Board of Governors, most economists said that Mr. Bernanke’s scholarly research on the Great Depression well-prepared him for the job.
Mr. Bernanke endorsed economists’ conventional wisdom that the Fed’s inappropriate actions at the Depression’s outset exacerbated the downturn. The Fed maintained a high-interest-rate policy to defend America gold reserves instead of reducing interest rates aggressively to stimulate borrowing and spending. Because of those high interest rates, so the conventional wisdom goes, a run-of-the-mill recession became the Great Depression.
That version of the Depression’s cause became a key ingredient of free-market ideology: Misguided government policy caused the Great Depression. This viewpoint soon became part and parcel of the notion that “Government Can’t.” Or, to paraphrase Ronald Reagan, “Government is the problem, not the solution.” The corollary: Let markets alone; don’t impede them with excess regulation, supervision and control.
President Bush appointed Ben Bernanke to lead the Fed because Mr. Bernanke espoused those free-market principles. These principles motivated Mr. Bernanke to maintain the hands-off stance of his predecessor, Alan Greenspan, an appointee of President Reagan. Mr. Greenspan and Mr. Bernanke took a minimalist approach: They let low interest rates and lax lending standards inflate the real-estate bubble.
As the bubble began to deflate and mortgage-backed securities became the toxic waste that led to the global financial crisis, Mr. Bernanke maintained his minimalist approach. Both he and Treasury Secretary Henry Paulson underplayed the crisis, invoking the doctrine of “moral hazard” to avoid bailing out foolish lenders. Instead of taking a systematic and systemic approach – such as the rescue package originating in Europe on the weekend of October 11 and 12 – Mr. Bernanke and Mr. Paulson proceeded in an ad hoc and haphazard fashion. They organized a bucket brigade instead of clearing a fire line. It was not until the European nations showed the way that they abandoned ideology and fully embraced pragmatic solutions.
What an irony. Economists endorsed Mr. Bernanke because they thought he had learned from mistakes the Fed had made during the Great Depression. Unfortunately, instead of embracing the benefits of an activist Fed that “can and should”, Mr. Bernanke came away with a minimalist free-market ideology that said the Fed “can’t and shouldn’t.” Instead of leading the charge for a robust and systematic response to the crisis, the Fed consistently remained one step behind.
© 2008 Michael B. Lehmann
Wednesday, October 8, 2008
True Value
THE BE YOUR OWN ECONOMIST ® BLOG
What are our assets truly worth?
The recent real-estate and stock-market debacles tell us that housing and equities were grossly overvalued.
There were two overvaluation bursts: The late 1990s and the recent real-estate run-up.
The late 1990s boom gave us an exaggerated notion of stock-market values. We came to believe that the dot-com boom’s lofty heights were true value, while the dot-com bust’s comedown was somehow artificial.
After the recent real-estate run-up, we embraced the notion that the recent boom was real and the subsequent bust was merely a bad dream. We feel that home values will pop back up to their earlier levels as soon as the nightmare is over.
The same is true for the latest stock-market reversal. Somehow the boom was true and the bust is false. We deserved those out-size values which, after all, were no higher than the levels we enjoyed during the late 1990s dot-com boom.
So when will the markets snap out of it and return us to true value?
Unfortunately they’re doing that right now, but not in the way we want. Capitalism may be a tale of wealth-creation, but it encompasses episodes of wealth-destruction. And we’re experiencing one today.
Think of the economy as a gigantic balance sheet, with real estate and stocks on the left side and debt on the right side. We pumped up the left side’s real estate and stocks by taking on enormous amounts of right-side debt. Now, as real-estate and stock-market holdings deflate, we are desperately attempting to repay our debts. The entire balance sheet is shrinking.
How far will it shrink? Back to true value.
© 2008 Michael B. Lehmann
Tuesday, October 7, 2008
Dow Down Another 508
THE BE YOUR OWN ECONOMIST ® BLOG
Fed Chairman Ben Bernanke’s speech (http://www.federalreserve.gov/newsevents/speech/bernanke20081007a.htm)
at today’s meeting of the National Association for Business Economics didn’t help the stock market. The Dow fell 508 points, compounding yesterday’s 370-point drop.
The Chairman said:
“All told, economic activity is likely to be subdued during the remainder of this year and into next year. The heightened financial turmoil that we have experienced of late may well lengthen the period of weak economic performance and further increase the risks to growth.”
Translation: We’re in a recession that may last until the end of next year.
Yesterday’s posting said the recession would erode earnings and reduce the P/E, and that these developments would further depress the stock market.
The following chart shows profit margins’ remarkable spring-back after the 2001 dot-com bust. You can see margins’ all-time peak in 2006 and the subsequent slippage in 2006 and 2007. It’s a safe bet that the current recession will depress margins through 2008 and 2009. Margins may even fall below their 2001 trough and recede to depths plumbed in earlier recessions.
Profit Margins
(Click on chart to enlarge)

Recessions shaded
In the next chart you can see profit margins’ powerful impact on after-tax corporate profits. Earnings more than doubled following the 2001 recession. But they were already beginning to turn in 2006 and 2007. As recession erodes profit margins, earnings will head south. How far will they fall? Nobody knows.
After-tax Earnings
(Click on chart to enlarge)

Recessions shaded
As recession spreads a pall of gloom over the economy and earnings slump, the price/earnings (P/E) ratio will also suffer.
S&P, P/E Ratio & Earnings Per Share
(Click on chart to enlarge)

Recessions shaded
Earnings’ strong performance since the dot.com bust kept the P/E (price/earnings) ratio above its historical pre-1990s average of about 15 to 1. That is, robust earnings inspired investors to maintain a high price for stocks relative to earnings. But falling earnings will now erode confidence, reducing the P/E and further depressing stocks.
In sum: Recession will depress both earnings and the P/E. That double whammy will drive stocks into the basement.
(The charts are taken from http://www.beyourowneconomist.com. [Click on Seminars and then Charts.] Go there for additional charts on the economy and a list of economic indicators.)
© 2008 Michael B. Lehmann
Monday, October 6, 2008
Dow Down 370
THE BE YOUR OWN ECONOMIST ® BLOG
Everyone’s talking about the world-wide financial crisis, and that may have been the main driver behind today’s 370-point-loss on the Dow. But don’t forget the effect of the recession that’s unfolding.
It will do two things: Erode earnings and reduce the P/E. Both of these developments will further depress the stock market.
Corporate earnings have done very well since the 2000 – 2002 dot.com bust. Now, with the recession, they’re headed for the basement. That alone would be bad for the stock market.
In addition, earnings’ strong performance since the dot.com bust kept the P/E (price/earnings) ratio above its historical average. Strong earnings inspired investors to maintain a high price for stocks relative to earnings. But falling earnings will erode confidence, further depressing stocks.
Tomorrow’s posting will mobilize a set of charts to illustrate these points.
© 2008 Michael B. Lehmann
Friday, October 3, 2008
Minus 159,000
THE BE YOUR OWN ECONOMIST ® BLOG
Nonfarm employment fell by 159,000 jobs in September according to the latest Bureau of Labor Statistics report (http://stats.bls.gov/news.release/empsit.nr0.htm).
Update the chart below with that data and you can see we are in recession. It’s just not official yet.
Job Growth
(Click on chart to enlarge)

(The charts are taken from http://www.beyourowneconomist.com. [Click on Seminars and then Charts.] Go there for additional charts on the economy and a list of economic indicators.)
© 2008 Michael B. Lehmann
Nonfarm employment fell by 159,000 jobs in September according to the latest Bureau of Labor Statistics report (http://stats.bls.gov/news.release/empsit.nr0.htm).
Update the chart below with that data and you can see we are in recession. It’s just not official yet.
Job Growth
(Click on chart to enlarge)

Recessions shaded
Will the bailout stop the economy’s slide? It can’t. It’s too late. There’s too much bad news and the economy is deteriorating at too rapid a rate. The choice before us now is: Bad recession or horrible recession, not whether or not there will be a recession.
If the bailout works, we’ll have a bad recession that lasts quite a while. If the bailout doesn’t work, we’ll have a horrible recession that lasts even longer.
Stay tuned.
(The charts are taken from http://www.beyourowneconomist.com. [Click on Seminars and then Charts.] Go there for additional charts on the economy and a list of economic indicators.)
© 2008 Michael B. Lehmann
Thursday, October 2, 2008
Recent Data
THE BE YOUR OWN ECONOMIST ® BLOG
Even if the House backs up the Senate and passes the bailout bill, that won’t save us from recession.
Yesterday the Institute for Supply Management released its Purchasing Managers’ Index for September: 43.5 (above 50 = manufacturing expanding, below 50 = manufacturing contracting). The index has been hanging out for months at just under 50. The recent figure indicates a sharp contraction in manufacturing activity.
Meanwhile the Commerce Department just disclosed that the auto industry sold 12.5 million vehicles in September. Last year’s September figure was 16.1 million. Enough said.
Finally, the Census Bureau announced today $68.6 billion worth of new orders for nondefense capital goods in September. It’s been flat, averaging in the mid 70s, for most of the year. Another sharp drop.
The bailout can’t reverse these trends. We may have been saved from a severe recession, but we haven’t been saved from recession.
© 2008 Michael B. Lehmann
Wednesday, October 1, 2008
October Publication Schedule & Web Sources
THE BE YOUR OWN ECONOMIST ® BLOG
You can use the WEB SOURCES listing (below) to find the data on your own and read the accompanying press release. The addresses take you to the source’s home page and the steps tell you how to navigate the site. That way (rather than provide a direct link to the data) you can become familiar with these sites and find additional information on your own.
PUBLICATION SCHEDULE
October 2008
Source (* below)…………Series Description…………Day & Date
Quarterly Data
BEA…………………………GDP……………………...……Thu, 30th
Monthly Data
ISM………………….Purchasing managers’ index……….Wed, 1st
Fed…………………………..Consumer credit……..……….Tue, 7th
BLS………………………….Employment………………… Fri, 3rd
Census……………………...Balance of trade………………Fri, 10th
Census……………………...Retail trade…………………….Wed, 15th
Census……………………...Inventories……………………..Wed, 15th
BLS………………………….Consumer prices……………...Thu, 16th
Fed…………………………..Industrial production………….Thu, 16th
Fed………………………….Capacity utilization…………….Thu, 16th
Census……………………..Housing starts………………….Fri, 17th
BLS………………………….Producer prices……………….Wed, 15th
Conf Bd…………………….Leading Indicators…………….Mon, 20th
Conf Bd…………………….Consumer confidence…………Tue, 28th
Census…………………….Capital goods……………….…..Wed, 29th
Census……………………..New-home sales……………….Mon, 27th
NAR…………………………Existing-home sales…….…….Fri, 24th
* BEA = Bureau of Economic Analysis of the U.S. Department of Commerce
* BLS = Bureau of Labor Statistics of the U.S. Department of Labor
* Census = U.S. Bureau of the Census
* Conf Bd = Conference Board
* Fed = Federal Reserve System
* ISM = Institute for Supply Management
* NAR = National Association of Realtors
WEB SOURCES
Index of Leading Economic Indicators: http://www.conference-board.org/..........
Step 1: Click on "Economics" in the left-hand menu bar…………………………………….
Step 2: Click on "Economic Indicators" under "Economics" in the left-hand menu bar………………………………………………………………………………………………………………..
Step 3: Click on link under "U.S. Leading Indicators"………………………………………
Gross Domestic Product: http://www.bea.gov/....................................................
Step 1: Click on "Gross Domestic Product" under "National"………………………….
Step 2: Click on "National Income and Product Accounts Tables" under "Gross Domestic Product (GDP)"……………………………………………………………………………
Step 3: Click on "list of all NIPA Tables"………………………………………………………….
Step 4: Click on "Table 1.1.6. Real Gross Domestic Product..." and "Table 1.1.1. Percent Change..."……………………………………………………………………………………….
Step 5: Scroll down to line 1 in both tables and go to the last column on the right
Industrial Production & Capacity Utilization: http://www.federalreserve.gov/
Step 1: Click on "All Statistical Releases" under "Recent Statistical Releases" and then click on "Industrial Production and Capacity Utilization" under "Principal Economic Indicators" in the upper left…………………………………………………………
Step 2: Find the latest monthly data in the table next to "Total index" and "Total industry"……………………………………………………………………………………………………..
Institute For Supply Management Index: http://www.ism.ws/ ……………………….
Step 1: Click on "ISM Report on Business" in left-hand menu bar……………………
Step 2: Click on “Latest Manufacturing ROB” and find the latest PMI…………….
Producer Prices: http://stats.bls.gov/.....................................................................
Step 1: Click on “Producer Price Indexes” under “Inflation & Consumer Spending” in left-hand menu bar………………………………………………………………….
Step 2: Note "Finished goods" under "Latest Numbers" in upper right and multiply by 12 to put the data on an annual basis……………………………………….
Business Capital Expenditures (Nondefense Capital Goods): http://www.census.gov/ ……………………………
1: Click on "Economic Indicators" in the lower right…………………………………
Step 2: Click on "PDF" on the left under "Advance Report on Durable Goods Manufacturers' Shipments and Orders"…………………………………………………………..
Step 3: Scroll down to Table 1 and find new orders for nondefense capital goods near the bottom……………………………………………………………………………………………..
Inventories, Sales & Inventory/Sales Ratio: http://www.census.gov/
Step 1: Click on "Economic Indicators" in the lower right…………………………………
Step 2: Click on "HTML" on the left under "Manufacturing and Trade Inventories and Sales"..........................
Step 3: Scroll down to Table 1 and subtract previous month's inventories from latest month's and multiply by 12 to obtain inventory change, and then obtain the most recent inventory/sales ratio……………………………………………………………………
Consumer Price Index: http://stats.bls.gov/...........................................................
Step 1: Click on “Consumer Price Index” under “Inflation & Consumer Spending” in left-hand menu bar………………………………………………………………………………….
Step 2: Note "CPI-U..." at the top under "Latest Numbers" in upper right and multiply "SA" by 12 to put the data on an annual basis…………………………………..
Employment Data (Total Non-farm Payroll Employment) (Unemployment Rate) (Manufacturing Workweek): http://stats.bls.gov/ ………………………………………..
Step 1: Click on “National Employment” under “Employment & Unemployment” in right-hand menu bar………………………………………………………………………………
Step 2: Click on (HTML) following “Employment Situation Summary” under "Economic News Releases"……………………………………………………………………….
Step 3: Click on “Employment Situation Summary” under “Table of Contents”
Step 4: Scroll down to Table A and find the unemployment rate for all workers in the latest month, the change in nonfarm employment in the last column and manufacturing hours of work for the latest month…………………………………………..
Personal Income: http://www.bea.gov/.....................................................................
Step 1: Click on "Gross Domestic Product" under "National"……………………………..
Step 2: Click on "National Income and Product Accounts Tables" under "Gross Domestic Product (GDP)"…………………………………………………………………………….
Step 3: Click on "list of all NIPA Tables"……………………………………………………….
Step 4: Click on "Table 2.6 Personal Income..."…………………………………………………
Step 5: Scroll down to line 1…………………………………………………………………………..
Consumer Confidence: http://www.conference-board.org/....................................
Step 1: Click on the "Economics" in the left-hand menu bar……………………………….
Step 2: Click on "Economic Indicators" under "Economics" in the left-hand menu bar………………………………………………………………………………………………………………..
Step 3: Click on link under "Consumer Confidence Index"…………………………………
Consumer Credit: http://www.federalreserve.gov/...................................................
Step 1: Click on "All Statistical Releases" under "Recent Statistical Releases" and then click on "Consumer credit -- G19" under "Household Finance" in the upper right…………………………………………………………………………………………………………..
Step 2: Click on "Current Release"…………………………………………………………………
Step 3: Go to "Amount ... billions of dollars" and subtract previous month from current month & multiply by 12 to obtain seasonally adjusted dollar amount at annual rate………………………………………………………………………………………………..
Housing Starts: http://www.census.gov/..................................................................
Step 1: Click on "Economic Indicators" in the lower right………………………………….
Step 2: Click on "PDF" on the left under "Current Press Release" under "Housing Starts/Building Permits"………………………………………………………………………………..
Step 3: Scroll down to "Housing Starts"…………………………………………………………..
Home Sales (Existing-Home Sales): http://www.realtor.org/.................................
Step 1: Click on "Research" in the left-hand menu bar……………………………………….
Step 2: Find "Existing-Home Sales" under "Housing Indicators"……………………..
Home Sales (New-Home Sales): http://www.census.gov/.......................................
Step 1: Click on "Economic Indicators" in the lower right………………………………..
Step 2: Click on "PDF" on the left under "Current Press Release" under "New Home Sales"………………………………………………………………………………………………….
Retail Sales: http://www.census.gov/.......................................................................
Step 1: Click on "Economic Indicators" in the lower right…………………………………..
Step 2: Scroll down to "Advance Monthly Sales for Retail and Food Services" and click on "HTML" on the left under "Current Press Release"………………………………
© 2008 Michael B. Lehmann
Subscribe to:
Posts (Atom)