This week’s developments have been a good-news bad-news joke in reverse. The bad news hits, and then the stock market rises.
Yesterday Fed Vice Chairman Donald Kohn, in a speech before the Council on Foreign Relations (http://www.federalreserve.gov/newsevents/speech/kohn20071128a.htm), said:
“To be sure, lowering interest rates to keep the economy on an even keel when adverse financial market developments occur will reduce the penalty incurred by some people who exercised poor judgment. But these people are still bearing the costs of their decisions and we should not hold the economy hostage to teach a small segment of the population a lesson.”
These words convinced investors that the Fed would not hold the economy hostage by maintaining high interest rates. The prospects of further rate cuts powered yesterday’s outstanding stock-market rally, which followed immediately upon Monday’s strong gains.
But we should all keep in mind that Mr. Kohn made his remarks because he believes the economy is losing strength. Yesterday the Fed also released its Beige Book economic survey (http://www.federalreserve.gov/fomc/beigebook/2007/20071128/default.htm), whose summary began with the words:
“Reports from the twelve Federal Reserve Districts suggest that the national economy continued to expand during the survey period of October through mid-November but at a reduced pace compared with the previous survey period. Among Districts, seven reported a slower pace of economic activity while the remainder generally pointed to modest expansion or mixed conditions.”
The economy continues to expand, but at a reduced rate, and 7 of the 12 Federal Reserve districts reported a slower pace of economic activity. That looks like a turning point.
Today's releases reinforce the notion of a turning point.
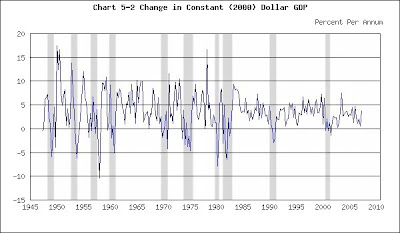
The Commerce Department’s Bureau of Economic analysis reported this morning that GDP grew 4.9% in the third quarter: http://www.bea.gov/newsreleases/national/gdp/2007/gdp307p.htm.
GDP
(Click on chart to enlarge)
Recessions shaded
If you update the chart with that number, you’ll find nothing disappointing.
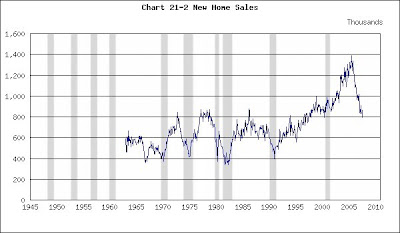
Today’s other release is not so positive. The Census Bureau reported (http://www.census.gov/const/newressales.pdf) 728,000 new homes sold in October.
New Home Sales
(Click on chart to enlarge)
Recessions shaded
When you update this chart you can see that 728,000 maintains the downward trend and that sales are now half their earlier peak. Notice that sales losses of that magnitude forecast earlier recessions. Also, sales are now lower than they were before the current boom began at the conclusion of the 2001 recession. All those gains have been lost.
What to make of these conflicting reports? You can sort it out if you keep in mind that the (good) GDP report was a broad-brush picture of the economy from July through September, while October’s (bad) home-sales figure focuses on a leading indicator. That’s consistent with a turning point. (And a good-news, bad-news story.)
(The charts are taken from http://www.beyourowneconomist.com. [Click on Seminars and then Charts.] Go there for additional charts on the economy and a list of economic indicators.)
