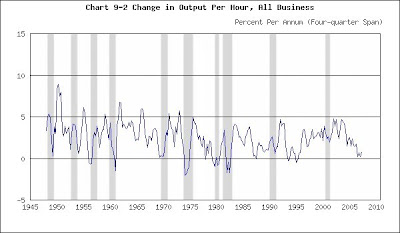
Stocks jumped this morning when the Bureau of Labor Statistics (BLS) announced (http://stats.bls.gov/news.release/prod2.nr0.htm) that third-quarter productivity had surged 6.7%. Use that number to update the chart below in your mind’s eye, and you’ll appreciate the impressive size of this gain. There hasn’t been a jump like that in years.
Productivity
(Click on chart to enlarge)

Recessions shaded
Productivity measures the economy’s efficiency: How much output grows for each additional hour of labor employed. (Think of miles per gallon [MPG] as an analogy. An efficient engine travels further - and less expensively - on a gallon of fuel.) Greater output per hour of work indicates that fewer hours were required to complete a task. Since labor must be paid, rising productivity – and falling labor time per unit of output – implies falling costs. And sure enough, the BLS also reported unit labor costs fell 2.0% in the third quarter.
Investors love reports like these because rising productivity and falling costs signal a reduction in inflationary pressures. That means the Fed is more likely to reduce interest rates at its December 11 meeting. Falling interest rates are good for stocks because stock prices rise when investors desert interest-earning assets (with declining yields) in order to purchase stocks.
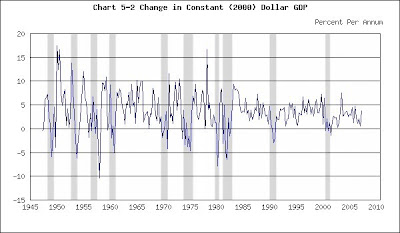
But before you conclude that the New Economy has taken on new life, consider the following. The BLS report states third-quarter GDP’s rapid rise accounts for most of the productivity gain. Update the chart below with GDP’s 4.9% third-quarter jump, and you’ll note an increase that is almost as impressive as productivity’s surge.
GDP
(Click on chart to enlarge)

Recessions shaded
The point is: Productivity tends to fluctuate with output. We had good fortune in the third quarter when output and productivity leapt upward. If GDP growth begins to falter as the economy weakens in the months ahead, expect diminishing productivity gains and rising costs. That will constrain the Fed’s freedom of action and investor’s enthusiasm.
(The charts are taken from http://www.beyourowneconomist.com. [Click on Seminars and then Charts.] Go there for additional charts on the economy and a list of economic indicators.)
No comments:
Post a Comment