At the beginning of each month The Wall Street Journal publishes an article on the prior month’s auto sales. Today’s story (http://online.wsj.com/article/SB119643941326509603.html?mod=hpp_us_whats_news) carried an interesting quote:
“Auto makers had grown accustomed to industry sales of around 17 million. The industry's overall seasonally adjusted annual selling pace in November was 16.2 million light vehicles, according to Autodata.
“Ford's production cut reflected a "particularly challenging" market environment, said George Pipas, the auto maker's top sales analyst, adding that the nation's economic outlook "contains a high level of uncertainty." Ford expects 2008 total sales to track as low as 15.2 million light vehicles during the first six months of next year, or nearly a million fewer than 2007's expected total, Mr. Pipas said, though he stressed that projection wasn't Ford's finalized full-year forecast.”
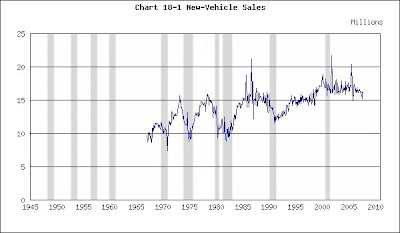
Take a look at the following chart to put this information in perspective.
New-Vehicle Sales
(Click on chart to enlarge)

Recessions shaded
You can see why auto sales are of interest. They led the economy into recession in each slump over the past 40 years except for the last one. In 2001 the auto manufacturers kept sales aloft by slashing customers’ financing costs. Since then auto purchases have been on a remarkable plateau. As the quote above said, “Auto makers had grown accustomed to industry sales of around 17 million.”
The article reports a16.2 million annual selling pace in November and tells us that Ford forecasts a 15.2 million rate in the first half of 2008. That’s not bad, and nowhere near a recessionary slump. If that forecast proves correct, auto sales will not drag the economy into recession’s trough.
These sales numbers and projections are important because, as earlier editions of this blog have observed, a slump in residential-construction activity has never been enough to instigate recession. In the past surging inflation constricted consumer confidence and reduced construction and auto activity. Housing AND autos led the way into recession, never housing alone.
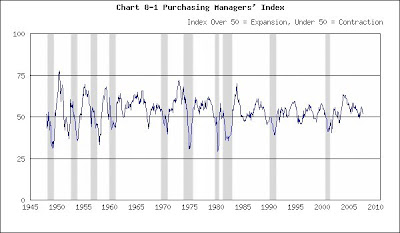
Neither housing nor autos slumped in the 2001 recession. A contraction in business capital expenditures led that decline. That’s why yesterday’s Institute for Supply Management (ISM) report on manufacturing activity (known as the Purchasing Managers’ Index) is important. The ISM disclosed that manufacturing continued to expand at an anemic pace of 50.8. (Anything over 50 signals expansion.)
Purchasing Managers’ Index
(Click on chart to enlarge)

Recessions shaded
The index fell during the 2001 recession and then recovered sharply as manufacturing expanded rapidly. But the rate of expansion has trailed downward over the past few years and is now on the knife’s edge of falling into contraction. It’s tepid, but not yet cold.
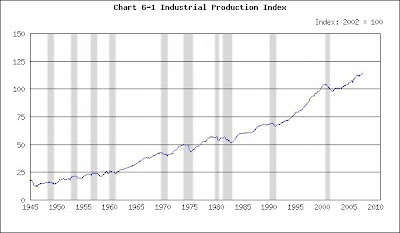
Industrial production’s record confirms this.
Industrial Production
(Click on chart to enlarge)

Recessions shaded
Industrial production stumbled in the 2001 recession when business curtailed its expansionary plans. Then it resumed its upward trend, although not at the torrid pace of the late 1990s. The Federal Reserve releases November’s data in ten days. If it replicates the ISM report, there will be no signal that we’re in recession.
The housing debacle is awful, but that’s a single indicator. And most statistics, such as those discussed above, have not yet slumped. We must wait and see.
(The charts are taken from http://www.beyourowneconomist.com. [Click on Seminars and then Charts.] Go there for additional charts on the economy and a list of economic indicators.)
No comments:
Post a Comment