The Lehmann Letter ©
Everette P. Johnson at the Bureau of Economic Analysis has done a great job over the years maintaining the Bureau’s motor-vehicle-sales data base. The number for the previous month usually appears about the third or fourth of the current month. So there’s little delay.
Here’s how to obtain the data.
Step 1: Go to http://www.bea.gov/
Step 1: Click on "Gross Domestic Product" under "National"
Step 2: Scroll down and click on "Motor Vehicles" under "Supplemental Estimates"
Step 3: Save to your desktop as an Excel file and then open the file
Step 4: Click on the "Table 6" tab at the bottom of the page
Step 5: Look at column I (Light Total) and scroll down for the latest data
You can see that 10.5 million vehicles sold in October 2008 at a seasonally-adjusted annual rate.
Put that figure in perspective by reviewing the data over the past year.
2007
October .............16.0
November..........16.0
December...........16.0
2008
January..............15.3
February............15.3
March.................15.0
April...................14.5
May....................14.2
June...................13.6
July....................12.5
August................13.7
September..........12.5
October..............10.5
Sales were falling before the financial crisis. Then they began to collapse.
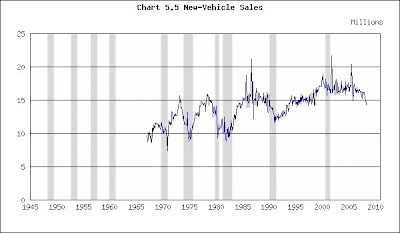
Now examine the chart for historical perspective, updating it in your mind’s eye with the 10.5 October total.
New-Vehicle Sales
(Click on chart to enlarge)

Recessions shaded
You can see that auto sales did not suffer in the 2001 recession. Falling interest rates kept them afloat, just as they buoyed residential real estate.
Nor did auto sales fall below 12 million in the 1990-91 recession.
We have to go back to1981-82 and earlier recessions for numbers that fleetingly dip below 10 million.
The most recent data and the swiftness of its plunge portend real disaster for the industry. Will sales drop below 10 million? If so, how far? What can save the industry? Falling fuel prices? Falling interest rates? Smaller vehicles? Maybe, maybe and maybe.
Then we’re reminded of consumer confidence’s October reading – 38 – and that further dampens hope (http://beyourowneconomist.blogspot.com/2008/10/blue-christmas.html) because consumer confidence is at a post-WWII low. Why should consumers buy when they feel so miserable?
Now think of all those industries dependant upon motor-vehicle sales: steel, glass, rubber tires, fuzzy dice.
It’s not good.
(The chart was taken from http://www.beyourowneconomist.com. [Click on Seminars and then Charts.] Go there for additional charts on the economy and a list of economic indicators.)
© 2008 Michael B. Lehmann
No comments:
Post a Comment