
THE BE YOUR OWN ECONOMIST ® BLOG
The Lehmann Letter ©
The blogger will take a brief respite and return on or about November 19.
© 2008 Michael B. Lehmann
Tuesday, November 11, 2008

What About Homeowners?
THE BE YOUR OWN ECONOMIST ® BLOG
The Lehmann Letter ©
Every day we learn the government bailout has been extended to more businesses or there’s an effort under way to broaden the bailout’s coverage.
The banks are gobbling up their share of the $700 billion package. AIG’s assistance has topped $100 billion. The automakers will probably receive a rescue package. American Express has obtained permission to become a bank in order to ease the strains facing its credit-card business.
Meanwhile, home prices continue to plunge as foreclosures grow. Millions will lose their homes and millions more will end up under water (mortgage debt exceeds home’s value). What’s fair about that? Why should homeowners suffer while financial institutions and manufacturers are thrown a life line?
Everyone knows what needs to be done. There should be an immediate 90-day moratorium on foreclosures. During that period mortgages should be written down to the property’s market value for those homeowners who can’t make their payments. This entails a means test, so one should be created. If the homeowner still can’t pay the mortgage, then the term of the loan should be extended and the interest rate reduced. The federal government can compensate the lender for any loss.
That would direct relief to those who need it most.
Would there be complaints by those not facing foreclosure because the means test demonstrated their ability to pay? Would they be jealous of those who received assistance when they did not? Perhaps. But it would still be worth it to stop the losses and halt the foreclosures.
Would prices stop falling? Probably not. But they would not fall as far as they will fall if we don’t stop the foreclosures.
Washington should stop thinking small!
© 2008 Michael B. Lehmann
The Lehmann Letter ©
Every day we learn the government bailout has been extended to more businesses or there’s an effort under way to broaden the bailout’s coverage.
The banks are gobbling up their share of the $700 billion package. AIG’s assistance has topped $100 billion. The automakers will probably receive a rescue package. American Express has obtained permission to become a bank in order to ease the strains facing its credit-card business.
Meanwhile, home prices continue to plunge as foreclosures grow. Millions will lose their homes and millions more will end up under water (mortgage debt exceeds home’s value). What’s fair about that? Why should homeowners suffer while financial institutions and manufacturers are thrown a life line?
Everyone knows what needs to be done. There should be an immediate 90-day moratorium on foreclosures. During that period mortgages should be written down to the property’s market value for those homeowners who can’t make their payments. This entails a means test, so one should be created. If the homeowner still can’t pay the mortgage, then the term of the loan should be extended and the interest rate reduced. The federal government can compensate the lender for any loss.
That would direct relief to those who need it most.
Would there be complaints by those not facing foreclosure because the means test demonstrated their ability to pay? Would they be jealous of those who received assistance when they did not? Perhaps. But it would still be worth it to stop the losses and halt the foreclosures.
Would prices stop falling? Probably not. But they would not fall as far as they will fall if we don’t stop the foreclosures.
Washington should stop thinking small!
© 2008 Michael B. Lehmann
Friday, November 7, 2008
Minus 1.2 Million, And Counting
THE BE YOUR OWN ECONOMIST ® BLOG
The Lehmann Letter ©
This morning’s employment report was remarkable (http://stats.bls.gov/news.release/empsit.nr0.htm). It began:
“Nonfarm payroll employment fell by 240,000 in October, and the unemployment rate rose from 6.1 to 6.5 percent, the Bureau of Labor Statistics of the U.S. Department of Labor reported today. October's drop in payroll employment followed declines of 127,000 in August and 284,000 in September, as revised. Employment has fallen by 1.2 million in the first 10 months of 2008; over half of the decrease has occurred in the past 3 months. In October, job losses continued in manufacturing, construction, and several service-providing industries. Health care and mining continued to add jobs.”
We lost 240,000 jobs last month and September’s loss was revised upward to 284,000. Moreover, we’ve lost 1.2 million jobs this year, for an average monthly loss of 120,000. That’s awful.
If you update the chart below in your mind’s eye, you can see that the recent monthly losses of 284,000 and 240,000 are as bad as the 2001 dot-com recession. And all signs seem to say: The worst is yet to come.
Job Growth
(Click on chart to enlarge)

© 2008 Michael B. Lehmann
The Lehmann Letter ©
This morning’s employment report was remarkable (http://stats.bls.gov/news.release/empsit.nr0.htm). It began:
“Nonfarm payroll employment fell by 240,000 in October, and the unemployment rate rose from 6.1 to 6.5 percent, the Bureau of Labor Statistics of the U.S. Department of Labor reported today. October's drop in payroll employment followed declines of 127,000 in August and 284,000 in September, as revised. Employment has fallen by 1.2 million in the first 10 months of 2008; over half of the decrease has occurred in the past 3 months. In October, job losses continued in manufacturing, construction, and several service-providing industries. Health care and mining continued to add jobs.”
We lost 240,000 jobs last month and September’s loss was revised upward to 284,000. Moreover, we’ve lost 1.2 million jobs this year, for an average monthly loss of 120,000. That’s awful.
If you update the chart below in your mind’s eye, you can see that the recent monthly losses of 284,000 and 240,000 are as bad as the 2001 dot-com recession. And all signs seem to say: The worst is yet to come.
Job Growth
(Click on chart to enlarge)

Recessions shaded
The chart was taken from http://www.beyourowneconomist.com. [Click on Seminars and then Charts.] Go there for additional charts on the economy and a list of economic indicators.)
The chart was taken from http://www.beyourowneconomist.com. [Click on Seminars and then Charts.] Go there for additional charts on the economy and a list of economic indicators.)
© 2008 Michael B. Lehmann
Wednesday, November 5, 2008
The New President’s Dilemma
THE BE YOUR OWN ECONOMIST ® BLOG
The Lehmann Letter ©
President-elect Barack Obama faces a dilemma.
A severe recession is unfolding. Demand, production, employment, income – all are falling and falling hard. The new president has two traditional remedies at his disposal: Reduce taxes so that consumers can purchase more, thereby stimulating production and employment, or increase public-works spending to directly boost employment. These remedies will, of course, raise the federal deficit.
Therein lies the dilemma: The president can not effectively deal with the recession and shrink the deficit. Which horn of the dilemma should the president choose? Fight the recession or deal with the deficit?
In the spring of 1933 the same dilemma confronted President Roosevelt. FDR had campaigned on a balanced-budget platform. But when he took office, current events left him no choice. FDR’S administration enacted sweeping measures that lifted federal spending and the federal deficit. The Works Progress Administration and the Civilian Conservation Corps spent billions on public works and employed millions. The deficit grew.
Barack Obama now confronts the most serious economic crisis and dilemma since the Great Depression. Like FDR he must choose between promoting economic recovery and containing the deficit. He can’t do both.
The new president can use the $700 billion bank bailout as a template. In that instance Congress moved decisively to meet the financial crisis. President Obama should present Congress with an equally large, bold and urgent program of tax cuts and spending increases to deal immediately with the recession. Households living from hand to mouth will spend any increase in after-tax income or extension of unemployment benefits. Now is the time to invest in the nation’s crumbling infrastructure and the energy-independence and green-technology programs that Mr. Obama advocated.
The deficit will grow dramatically and the new administration should deal with it as soon as economic recovery is assured. Meanwhile, interest rates have fallen and the dollar has strengthened, proving that foreign investors remain willing to purchase Treasury securities. Recession confronts us immediately; national bankruptcy does not.
Now is not the time to think small.
© 2008 Michael B. Lehmann
The Lehmann Letter ©
President-elect Barack Obama faces a dilemma.
A severe recession is unfolding. Demand, production, employment, income – all are falling and falling hard. The new president has two traditional remedies at his disposal: Reduce taxes so that consumers can purchase more, thereby stimulating production and employment, or increase public-works spending to directly boost employment. These remedies will, of course, raise the federal deficit.
Therein lies the dilemma: The president can not effectively deal with the recession and shrink the deficit. Which horn of the dilemma should the president choose? Fight the recession or deal with the deficit?
In the spring of 1933 the same dilemma confronted President Roosevelt. FDR had campaigned on a balanced-budget platform. But when he took office, current events left him no choice. FDR’S administration enacted sweeping measures that lifted federal spending and the federal deficit. The Works Progress Administration and the Civilian Conservation Corps spent billions on public works and employed millions. The deficit grew.
Barack Obama now confronts the most serious economic crisis and dilemma since the Great Depression. Like FDR he must choose between promoting economic recovery and containing the deficit. He can’t do both.
The new president can use the $700 billion bank bailout as a template. In that instance Congress moved decisively to meet the financial crisis. President Obama should present Congress with an equally large, bold and urgent program of tax cuts and spending increases to deal immediately with the recession. Households living from hand to mouth will spend any increase in after-tax income or extension of unemployment benefits. Now is the time to invest in the nation’s crumbling infrastructure and the energy-independence and green-technology programs that Mr. Obama advocated.
The deficit will grow dramatically and the new administration should deal with it as soon as economic recovery is assured. Meanwhile, interest rates have fallen and the dollar has strengthened, proving that foreign investors remain willing to purchase Treasury securities. Recession confronts us immediately; national bankruptcy does not.
Now is not the time to think small.
© 2008 Michael B. Lehmann
Tuesday, November 4, 2008
10.5
THE BE YOUR OWN ECONOMIST ® BLOG
The Lehmann Letter ©
Everette P. Johnson at the Bureau of Economic Analysis has done a great job over the years maintaining the Bureau’s motor-vehicle-sales data base. The number for the previous month usually appears about the third or fourth of the current month. So there’s little delay.
Here’s how to obtain the data.
Step 1: Go to http://www.bea.gov/
Step 1: Click on "Gross Domestic Product" under "National"
Step 2: Scroll down and click on "Motor Vehicles" under "Supplemental Estimates"
Step 3: Save to your desktop as an Excel file and then open the file
Step 4: Click on the "Table 6" tab at the bottom of the page
Step 5: Look at column I (Light Total) and scroll down for the latest data
You can see that 10.5 million vehicles sold in October 2008 at a seasonally-adjusted annual rate.
Put that figure in perspective by reviewing the data over the past year.
2007
October .............16.0
November..........16.0
December...........16.0
2008
January..............15.3
February............15.3
March.................15.0
April...................14.5
May....................14.2
June...................13.6
July....................12.5
August................13.7
September..........12.5
October..............10.5
Sales were falling before the financial crisis. Then they began to collapse.
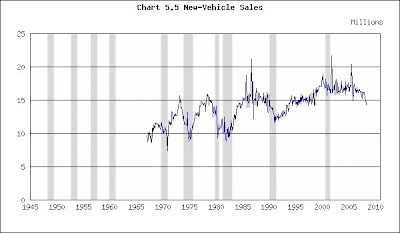
Now examine the chart for historical perspective, updating it in your mind’s eye with the 10.5 October total.
New-Vehicle Sales
(Click on chart to enlarge)
© 2008 Michael B. Lehmann
The Lehmann Letter ©
Everette P. Johnson at the Bureau of Economic Analysis has done a great job over the years maintaining the Bureau’s motor-vehicle-sales data base. The number for the previous month usually appears about the third or fourth of the current month. So there’s little delay.
Here’s how to obtain the data.
Step 1: Go to http://www.bea.gov/
Step 1: Click on "Gross Domestic Product" under "National"
Step 2: Scroll down and click on "Motor Vehicles" under "Supplemental Estimates"
Step 3: Save to your desktop as an Excel file and then open the file
Step 4: Click on the "Table 6" tab at the bottom of the page
Step 5: Look at column I (Light Total) and scroll down for the latest data
You can see that 10.5 million vehicles sold in October 2008 at a seasonally-adjusted annual rate.
Put that figure in perspective by reviewing the data over the past year.
2007
October .............16.0
November..........16.0
December...........16.0
2008
January..............15.3
February............15.3
March.................15.0
April...................14.5
May....................14.2
June...................13.6
July....................12.5
August................13.7
September..........12.5
October..............10.5
Sales were falling before the financial crisis. Then they began to collapse.
Now examine the chart for historical perspective, updating it in your mind’s eye with the 10.5 October total.
New-Vehicle Sales
(Click on chart to enlarge)

Recessions shaded
You can see that auto sales did not suffer in the 2001 recession. Falling interest rates kept them afloat, just as they buoyed residential real estate.
Nor did auto sales fall below 12 million in the 1990-91 recession.
We have to go back to1981-82 and earlier recessions for numbers that fleetingly dip below 10 million.
The most recent data and the swiftness of its plunge portend real disaster for the industry. Will sales drop below 10 million? If so, how far? What can save the industry? Falling fuel prices? Falling interest rates? Smaller vehicles? Maybe, maybe and maybe.
Then we’re reminded of consumer confidence’s October reading – 38 – and that further dampens hope (http://beyourowneconomist.blogspot.com/2008/10/blue-christmas.html) because consumer confidence is at a post-WWII low. Why should consumers buy when they feel so miserable?
Now think of all those industries dependant upon motor-vehicle sales: steel, glass, rubber tires, fuzzy dice.
It’s not good.
(The chart was taken from http://www.beyourowneconomist.com. [Click on Seminars and then Charts.] Go there for additional charts on the economy and a list of economic indicators.)
You can see that auto sales did not suffer in the 2001 recession. Falling interest rates kept them afloat, just as they buoyed residential real estate.
Nor did auto sales fall below 12 million in the 1990-91 recession.
We have to go back to1981-82 and earlier recessions for numbers that fleetingly dip below 10 million.
The most recent data and the swiftness of its plunge portend real disaster for the industry. Will sales drop below 10 million? If so, how far? What can save the industry? Falling fuel prices? Falling interest rates? Smaller vehicles? Maybe, maybe and maybe.
Then we’re reminded of consumer confidence’s October reading – 38 – and that further dampens hope (http://beyourowneconomist.blogspot.com/2008/10/blue-christmas.html) because consumer confidence is at a post-WWII low. Why should consumers buy when they feel so miserable?
Now think of all those industries dependant upon motor-vehicle sales: steel, glass, rubber tires, fuzzy dice.
It’s not good.
(The chart was taken from http://www.beyourowneconomist.com. [Click on Seminars and then Charts.] Go there for additional charts on the economy and a list of economic indicators.)
© 2008 Michael B. Lehmann
Monday, November 3, 2008
Another Bad Number
THE BE YOUR OWN ECONOMIST ® BLOG
The Lehmann Letter ©
Today the Institute for Supply Management reported its October Purchasing Managers’ Index at 38.9 (http://www.ism.ws/ISMReport/MfgROB.cfm?navItemNumber=12942).
Norbert J. Ore, the Institute’s chair, said: "The PMI indicates a significantly faster rate of decline in manufacturing when comparing October to September. It appears that manufacturing is experiencing significant demand destruction as a result of recent events, with members indicating challenges associated with the financial crisis, interruptions from the Gulf hurricane, and the lagging impact from higher oil prices. This is the lowest level for the PMI since September 1982 when it registered 38.8 percent. In this report, we see inflationary pressures dissolving as the Prices Index fell to 37 percent, the lowest since December 2001 when it registered 33.2 percent. Export orders also contracted for the first time following 70 months of growth."
Pay attention: ‘….. significantly faster rate of decline...,” “ significant demand destruction…,” “…”inflationary pressures dissolving…,” “…Export orders also contracted for the first time following 70 months of growth."
And then look again at that number – 38.9 – and use it to update the chart.
Purchasing Managers’ Index
(Click on chart to enlarge)

The Lehmann Letter ©
Today the Institute for Supply Management reported its October Purchasing Managers’ Index at 38.9 (http://www.ism.ws/ISMReport/MfgROB.cfm?navItemNumber=12942).
Norbert J. Ore, the Institute’s chair, said: "The PMI indicates a significantly faster rate of decline in manufacturing when comparing October to September. It appears that manufacturing is experiencing significant demand destruction as a result of recent events, with members indicating challenges associated with the financial crisis, interruptions from the Gulf hurricane, and the lagging impact from higher oil prices. This is the lowest level for the PMI since September 1982 when it registered 38.8 percent. In this report, we see inflationary pressures dissolving as the Prices Index fell to 37 percent, the lowest since December 2001 when it registered 33.2 percent. Export orders also contracted for the first time following 70 months of growth."
Pay attention: ‘….. significantly faster rate of decline...,” “ significant demand destruction…,” “…”inflationary pressures dissolving…,” “…Export orders also contracted for the first time following 70 months of growth."
And then look again at that number – 38.9 – and use it to update the chart.
Purchasing Managers’ Index
(Click on chart to enlarge)

Recessions shaded
We’re down to levels not seen since the 1981-82 recession. That’s bad.
But it will get worse. Manufacturing has only just begun its hard contraction. So far it’s been slipping. Now the sliding starts. As purchases of consumer durables (think autos) and nondurables (such as apparel) plunge in the fourth quarter, manufacturing activity will shrink.
How do we know? Check out the October 28 blog, Blue Christmas, at http://beyourowneconomist.blogspot.com/2008/10/blue-christmas.html.
Consumer confidence has fallen to its lowest recorded post-WWII level. Consumers won’t spend under those conditions, and manufacturers’ markets will consequently dry up.
And why should businesses invest in new capacity under these circumstances? That’s another weak spot for manufacturing.
Then scroll back up to see what Mr. Ore said about exports: “…Export orders also contracted for the first time following 70 months of growth." The rest of the world can’t buy our goods when their economies are shrinking and the dollar is stronger.
Finally, what about Mr. Ore’s comment that “…”inflationary pressures (are) dissolving….” Isn’t that a silver lining? Sorry, that’s just further confirmation that demand is weak.
The bottom line: Things are bad and getting worse.
(The chart was taken from http://www.beyourowneconomist.com. [Click on Seminars and then Charts.] Go there for additional charts on the economy and a list of economic indicators.)
© 2008 Michael B. Lehmann
November Publication Schedule & Web Sources
THE BE YOUR OWN ECONOMIST ® BLOG
The Lehmann Letter ©
You can use the WEB SOURCES listing (below) to find the data on your own and read the accompanying press release. The addresses take you to the source’s home page and the steps tell you how to navigate the site. That way (rather than provide a direct link to the data) you can become familiar with these sites and find additional information on your own.
PUBLICATION SCHEDULE
November 2008
Source (* below)…………Series Description…………Day & Date
Quarterly Data
BLS………………….Productivity………………………….Thu, 6th
BEA…………………………GDP……………………...……Tue, 25th
Monthly Data
ISM………………….Purchasing managers’ index……….Mon, 3rd
Fed…………………………..Consumer credit……..……….Fri, 7th
BLS………………………….Employment………………… Fri, 7th
Census……………………...Balance of trade………………Thu, 13th
Census……………………...Retail trade…………………….Fri, 14th
Census……………………...Inventories……………………..Fri, 14th
Fed…………………………..Industrial production………….Mon, 17th
Fed………………………….Capacity utilization…………….Mon, 17th
BLS………………………….Producer prices……………….Tue, 18th
BLS………………………….Consumer prices……………...Wed, 19th
Census……………………..Housing starts………………….Wed, 19th
Conf Bd…………………….Leading Indicators…………….Thu, 20th
NAR…………………………Existing-home sales…….…….Mon, 24th
Conf Bd…………………….Consumer confidence…………Tue, 25th
Census…………………….Capital goods……………….…..Wed, 26th
Census……………………..New-home sales……………….Wed, 26th
* BEA = Bureau of Economic Analysis of the U.S. Department of Commerce
* BLS = Bureau of Labor Statistics of the U.S. Department of Labor
* Census = U.S. Bureau of the Census
* Conf Bd = Conference Board
* Fed = Federal Reserve System
* ISM = Institute for Supply Management
* NAR = National Association of Realtors
WEB SOURCES
Index of Leading Economic Indicators: http://www.conference-board.org/..........
Step 1: Click on "Economics" in the left-hand menu bar…………………………………….
Step 2: Click on "Economic Indicators" under "Economics" in the left-hand menu bar………………………………………………………………………………………………………………..
Step 3: Click on link under "U.S. Leading Indicators"………………………………………
Gross Domestic Product: http://www.bea.gov/....................................................
Step 1: Click on "Gross Domestic Product" under "National"………………………….
Step 2: Click on "National Income and Product Accounts Tables" under "Gross Domestic Product (GDP)"……………………………………………………………………………
Step 3: Click on "list of all NIPA Tables"………………………………………………………….
Step 4: Click on "Table 1.1.6. Real Gross Domestic Product..." and "Table 1.1.1. Percent Change
Step 5: Scroll down to line 1 in both tables and go to the last column on the right
Industrial Production & Capacity Utilization: http://www.federalreserve.gov/
Step 1: Click on "All Statistical Releases" under "Recent Statistical Releases" and then click on "Industrial Production and Capacity Utilization" under "Principal Economic Indicators" in the upper left…………………………………………………………
Step 2: Find the latest monthly data in the table next to "Total index" and "Total industry"……………………………………………………………………………………………………..
Institute For Supply Management Index: http://www.ism.ws/ ……………………….
Step 1: Click on "ISM Report on Business" in left-hand menu bar……………………
Step 2: Click on “Latest Manufacturing ROB” and find the latest PMI…………….
Producer Prices: http://stats.bls.gov/.....................................................................
Step 1: Click on “Producer Price Indexes” under “Inflation & Consumer Spending” in left-hand menu bar………………………………………………………………….
Step 2: Note "Finished goods" under "Latest Numbers" in upper right and multiply by 12 to put the data on an annual basis……………………………………….
Business Capital Expenditures (Nondefense Capital Goods): http://www.census.gov/
Step 1: Click on "Economic Indicators" in the lower right…………………………………
Step 2: Click on "PDF" on the left under "Advance Report on Durable Goods Manufacturers' Shipments and Orders"…………………………………………………………..
Step 3: Scroll down to Table 1 and find new orders for nondefense capital goods near the bottom……………………………………………………………………………………………..
Inventories, Sales & Inventory/Sales Ratio: http://www.census.gov/
Step 1: Click on "Economic Indicators" in the lower right…………………………………
Step 2: Click on "HTML" on the left under "Manufacturing and Trade Inventories and Sales" Step 3: Scroll down to Table 1 and subtract previous month's inventories from latest month's and multiply by 12 to obtain inventory change, and then obtain the most recent inventory/sales ratio……………………………………………………………………
Consumer Price Index: http://stats.bls.gov/...........................................................
Step 1: Click on “Consumer Price Index” under “Inflation & Consumer Spending” in left-hand menu bar………………………………………………………………………………….
Step 2: Note "CPI-U..." at the top under "Latest Numbers" in upper right and multiply "SA" by 12 to put the data on an annual basis…………………………………..
Employment Data (Total Non-farm Payroll Employment) (Unemployment Rate) (Manufacturing Workweek): http://stats.bls.gov/ ………………………………………..
Step 1: Click on “National Employment” under “Employment & Unemployment” in right-hand menu bar………………………………………………………………………………
Step 2: Click on (HTML) following “Employment Situation Summary” under "Economic News Releases"……………………………………………………………………….
Step 3: Click on “Employment Situation Summary” under “Table of Contents”
Step 4: Scroll down to Table A and find the unemployment rate for all workers in the latest month, the change in nonfarm employment in the last column and manufacturing hours of work for the latest month…………………………………………..
Personal Income: http://www.bea.gov/.....................................................................
Step 1: Click on "Gross Domestic Product" under "National"……………………………..
Step 2: Click on "National Income and Product Accounts Tables" under "Gross Domestic Product (GDP)"…………………………………………………………………………….
Step 3: Click on "list of all NIPA Tables"……………………………………………………….
Step 4: Click on "Table 2.6 Personal Income...."
Step 5: Scroll down to line 1…………………………………………………………………………..
Consumer Confidence: http://www.conference-board.org/....................................
Step 1: Click on the "Economics" in the left-hand menu bar……………………………….
Step 2: Click on "Economic Indicators" under "Economics" in the left-hand menu bar………………………………………………………………………………………………………………..
Step 3: Click on link under "Consumer Confidence Index"…………………………………
Consumer Credit: http://www.federalreserve.gov/...................................................
Step 1: Click on "All Statistical Releases" under "Recent Statistical Releases" and then click on "Consumer credit -- G19" under "Household Finance" in the upper right…………………………………………………………………………………………………………..
Step 2: Click on "Current Release"…………………………………………………………………
Step 3: Go to "Amount ... billions of dollars" and subtract previous month from current month & multiply by 12 to obtain seasonally adjusted dollar amount at annual rate………………………………………………………………………………………………..
Housing Starts: http://www.census.gov/..................................................................
Step 1: Click on "Economic Indicators" in the lower right………………………………….
Step 2: Click on "PDF" on the left under "Current Press Release" under "Housing Starts/Building Permits"………………………………………………………………………………..
Step 3: Scroll down to "Housing Starts"…………………………………………………………..
Home Sales (Existing-Home Sales): http://www.realtor.org/.................................
Step 1: Click on "Research" in the left-hand menu bar……………………………………….
Step 2: Find "Existing-Home Sales" under "Housing Indicators"……………………..
Home Sales (New-Home Sales): http://www.census.gov/.......................................
Step 1: Click on "Economic Indicators" in the lower right………………………………..
Step 2: Click on "PDF" on the left under "Current Press Release" under "New Home Sales"………………………………………………………………………………………………….
Retail Sales: http://www.census.gov/.......................................................................
Step 1: Click on "Economic Indicators" in the lower right…………………………………..
Step 2: Scroll down to "Advance Monthly Sales for Retail and Food Services" and click on "HTML" on the left under "Current Press Release"………………………………
© 2008 Michael B. Lehmann
The Lehmann Letter ©
You can use the WEB SOURCES listing (below) to find the data on your own and read the accompanying press release. The addresses take you to the source’s home page and the steps tell you how to navigate the site. That way (rather than provide a direct link to the data) you can become familiar with these sites and find additional information on your own.
PUBLICATION SCHEDULE
November 2008
Source (* below)…………Series Description…………Day & Date
Quarterly Data
BLS………………….Productivity………………………….Thu, 6th
BEA…………………………GDP……………………...……Tue, 25th
Monthly Data
ISM………………….Purchasing managers’ index……….Mon, 3rd
Fed…………………………..Consumer credit……..……….Fri, 7th
BLS………………………….Employment………………… Fri, 7th
Census……………………...Balance of trade………………Thu, 13th
Census……………………...Retail trade…………………….Fri, 14th
Census……………………...Inventories……………………..Fri, 14th
Fed…………………………..Industrial production………….Mon, 17th
Fed………………………….Capacity utilization…………….Mon, 17th
BLS………………………….Producer prices……………….Tue, 18th
BLS………………………….Consumer prices……………...Wed, 19th
Census……………………..Housing starts………………….Wed, 19th
Conf Bd…………………….Leading Indicators…………….Thu, 20th
NAR…………………………Existing-home sales…….…….Mon, 24th
Conf Bd…………………….Consumer confidence…………Tue, 25th
Census…………………….Capital goods……………….…..Wed, 26th
Census……………………..New-home sales……………….Wed, 26th
* BEA = Bureau of Economic Analysis of the U.S. Department of Commerce
* BLS = Bureau of Labor Statistics of the U.S. Department of Labor
* Census = U.S. Bureau of the Census
* Conf Bd = Conference Board
* Fed = Federal Reserve System
* ISM = Institute for Supply Management
* NAR = National Association of Realtors
WEB SOURCES
Index of Leading Economic Indicators: http://www.conference-board.org/..........
Step 1: Click on "Economics" in the left-hand menu bar…………………………………….
Step 2: Click on "Economic Indicators" under "Economics" in the left-hand menu bar………………………………………………………………………………………………………………..
Step 3: Click on link under "U.S. Leading Indicators"………………………………………
Gross Domestic Product: http://www.bea.gov/....................................................
Step 1: Click on "Gross Domestic Product" under "National"………………………….
Step 2: Click on "National Income and Product Accounts Tables" under "Gross Domestic Product (GDP)"……………………………………………………………………………
Step 3: Click on "list of all NIPA Tables"………………………………………………………….
Step 4: Click on "Table 1.1.6. Real Gross Domestic Product..." and "Table 1.1.1. Percent Change
Step 5: Scroll down to line 1 in both tables and go to the last column on the right
Industrial Production & Capacity Utilization: http://www.federalreserve.gov/
Step 1: Click on "All Statistical Releases" under "Recent Statistical Releases" and then click on "Industrial Production and Capacity Utilization" under "Principal Economic Indicators" in the upper left…………………………………………………………
Step 2: Find the latest monthly data in the table next to "Total index" and "Total industry"……………………………………………………………………………………………………..
Institute For Supply Management Index: http://www.ism.ws/ ……………………….
Step 1: Click on "ISM Report on Business" in left-hand menu bar……………………
Step 2: Click on “Latest Manufacturing ROB” and find the latest PMI…………….
Producer Prices: http://stats.bls.gov/.....................................................................
Step 1: Click on “Producer Price Indexes” under “Inflation & Consumer Spending” in left-hand menu bar………………………………………………………………….
Step 2: Note "Finished goods" under "Latest Numbers" in upper right and multiply by 12 to put the data on an annual basis……………………………………….
Business Capital Expenditures (Nondefense Capital Goods): http://www.census.gov/
Step 1: Click on "Economic Indicators" in the lower right…………………………………
Step 2: Click on "PDF" on the left under "Advance Report on Durable Goods Manufacturers' Shipments and Orders"…………………………………………………………..
Step 3: Scroll down to Table 1 and find new orders for nondefense capital goods near the bottom……………………………………………………………………………………………..
Inventories, Sales & Inventory/Sales Ratio: http://www.census.gov/
Step 1: Click on "Economic Indicators" in the lower right…………………………………
Step 2: Click on "HTML" on the left under "Manufacturing and Trade Inventories and Sales" Step 3: Scroll down to Table 1 and subtract previous month's inventories from latest month's and multiply by 12 to obtain inventory change, and then obtain the most recent inventory/sales ratio……………………………………………………………………
Consumer Price Index: http://stats.bls.gov/...........................................................
Step 1: Click on “Consumer Price Index” under “Inflation & Consumer Spending” in left-hand menu bar………………………………………………………………………………….
Step 2: Note "CPI-U..." at the top under "Latest Numbers" in upper right and multiply "SA" by 12 to put the data on an annual basis…………………………………..
Employment Data (Total Non-farm Payroll Employment) (Unemployment Rate) (Manufacturing Workweek): http://stats.bls.gov/ ………………………………………..
Step 1: Click on “National Employment” under “Employment & Unemployment” in right-hand menu bar………………………………………………………………………………
Step 2: Click on (HTML) following “Employment Situation Summary” under "Economic News Releases"……………………………………………………………………….
Step 3: Click on “Employment Situation Summary” under “Table of Contents”
Step 4: Scroll down to Table A and find the unemployment rate for all workers in the latest month, the change in nonfarm employment in the last column and manufacturing hours of work for the latest month…………………………………………..
Personal Income: http://www.bea.gov/.....................................................................
Step 1: Click on "Gross Domestic Product" under "National"……………………………..
Step 2: Click on "National Income and Product Accounts Tables" under "Gross Domestic Product (GDP)"…………………………………………………………………………….
Step 3: Click on "list of all NIPA Tables"……………………………………………………….
Step 4: Click on "Table 2.6 Personal Income...."
Step 5: Scroll down to line 1…………………………………………………………………………..
Consumer Confidence: http://www.conference-board.org/....................................
Step 1: Click on the "Economics" in the left-hand menu bar……………………………….
Step 2: Click on "Economic Indicators" under "Economics" in the left-hand menu bar………………………………………………………………………………………………………………..
Step 3: Click on link under "Consumer Confidence Index"…………………………………
Consumer Credit: http://www.federalreserve.gov/...................................................
Step 1: Click on "All Statistical Releases" under "Recent Statistical Releases" and then click on "Consumer credit -- G19" under "Household Finance" in the upper right…………………………………………………………………………………………………………..
Step 2: Click on "Current Release"…………………………………………………………………
Step 3: Go to "Amount ... billions of dollars" and subtract previous month from current month & multiply by 12 to obtain seasonally adjusted dollar amount at annual rate………………………………………………………………………………………………..
Housing Starts: http://www.census.gov/..................................................................
Step 1: Click on "Economic Indicators" in the lower right………………………………….
Step 2: Click on "PDF" on the left under "Current Press Release" under "Housing Starts/Building Permits"………………………………………………………………………………..
Step 3: Scroll down to "Housing Starts"…………………………………………………………..
Home Sales (Existing-Home Sales): http://www.realtor.org/.................................
Step 1: Click on "Research" in the left-hand menu bar……………………………………….
Step 2: Find "Existing-Home Sales" under "Housing Indicators"……………………..
Home Sales (New-Home Sales): http://www.census.gov/.......................................
Step 1: Click on "Economic Indicators" in the lower right………………………………..
Step 2: Click on "PDF" on the left under "Current Press Release" under "New Home Sales"………………………………………………………………………………………………….
Retail Sales: http://www.census.gov/.......................................................................
Step 1: Click on "Economic Indicators" in the lower right…………………………………..
Step 2: Scroll down to "Advance Monthly Sales for Retail and Food Services" and click on "HTML" on the left under "Current Press Release"………………………………
© 2008 Michael B. Lehmann
Subscribe to:
Posts (Atom)